MACD Indicator Explained: A Complete Guide to MACD Crossovers
Sep 23, 2026
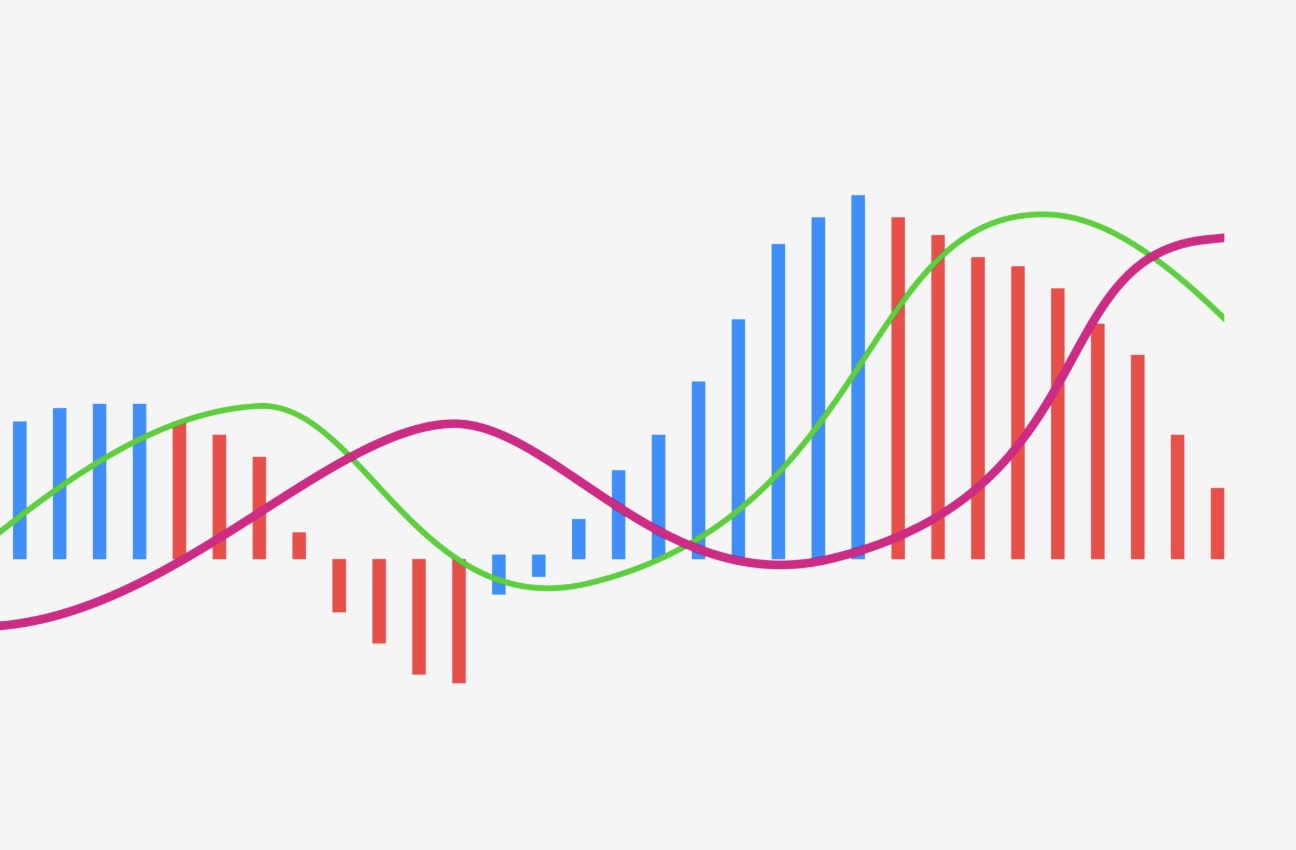
Learn what the MACD (Moving Average Convergence Divergence) is, how it's calculated, how to read crossovers, the histogram and divergence, and how to set up an automatic MACD alert on TradingSignal.
The Moving Average Convergence Divergence (MACD) is one of the most widely used indicators in technical analysis. It combines trend-following and momentum in a single tool, which makes it popular with crypto, stock and forex traders alike. This guide explains what the MACD is, how it is calculated, how to read MACD crossovers, histogram and divergence signals, and how to set up an automatic MACD alert on TradingSignal.
What Is the MACD Indicator?
The MACD was developed by Gerald Appel in the late 1970s. It measures the relationship between two exponential moving averages (EMAs) of price: a fast one and a slow one. When the two averages move apart, momentum is strengthening. When they move closer together, momentum is fading. That is where the name comes from: the moving averages converge and diverge.
On a chart, the MACD is usually displayed in a separate panel below price and is made of three elements:
- The MACD line: the difference between the fast EMA and the slow EMA.
- The signal line: an EMA of the MACD line itself, used to generate trade signals.
- The histogram: bars showing the distance between the MACD line and the signal line.
Unlike the RSI, the MACD is not bound to a fixed range. It oscillates above and below a zero line, and its values depend on the price of the asset.
How Is the MACD Calculated?
The MACD uses three settings, commonly written as MACD(12, 26, 9):
- Fast length (12): the period of the fast EMA.
- Slow length (26): the period of the slow EMA.
- Signal length (9): the period of the EMA applied to the MACD line.
The formulas are:
- MACD line = EMA(12) − EMA(26)
- Signal line = EMA(9) of the MACD line
- Histogram = MACD line − Signal line
You don't need to calculate this by hand. Charting platforms and tools like TradingSignal compute it automatically, but knowing the formula helps you understand why the MACD reacts the way it does: because it is built from moving averages, it always lags price slightly.
How to Read the MACD
MACD Signal Line Crossovers
Signal line crossovers are the most common MACD signals:
- Bullish crossover: the MACD line crosses above the signal line. Upside momentum is accelerating, and many traders read it as a potential buy signal.
- Bearish crossover: the MACD line crosses below the signal line. Downside momentum is accelerating, and many traders read it as a potential sell signal.
Crossovers that happen far from the zero line tend to be more meaningful than those that happen in a flat, tangled area close to zero, where the lines cross back and forth frequently.
Zero Line Crossovers
The zero line is where the fast and slow EMAs are equal:
- MACD above zero: the fast EMA is above the slow EMA, so the short-term trend is bullish.
- MACD below zero: the fast EMA is below the slow EMA, so the short-term trend is bearish.
A cross of the MACD line above zero is often used as a trend confirmation, and a cross below zero as a warning that the trend has turned down. A bullish signal line crossover that happens above the zero line lines up with the prevailing trend and is generally considered stronger.
Reading the MACD Histogram
The histogram shows momentum at a glance. Growing bars mean the gap between the MACD and the signal line is widening, so momentum is increasing. Shrinking bars mean momentum is fading, often before a crossover actually happens. Many traders watch the histogram to anticipate crossovers rather than wait for them.
MACD Divergence
Like the RSI, the MACD can diverge from price, which is often an early warning of a trend change:
- Bullish divergence: price makes a lower low, but the MACD makes a higher low. Selling pressure is weakening, and a reversal to the upside may follow.
- Bearish divergence: price makes a higher high, but the MACD makes a lower high. Buying pressure is weakening, and a reversal to the downside may follow.
Divergence can last a long time before price reacts, so it is best used as an alert to pay attention rather than as an immediate entry signal. Waiting for a signal line crossover in the direction of the divergence is a common way to confirm it.
Choosing MACD Settings and Timeframe
The classic 12, 26, 9 settings work well for most markets, but they are not a fixed rule:
- Faster settings (for example 5, 35, 5 or 8, 17, 9) make the MACD more responsive, producing earlier signals but more false ones. They are popular with short-term traders.
- Slower settings (for example 19, 39, 9 or 24, 52, 9) smooth the indicator and produce fewer, more reliable signals. They suit swing traders and position traders.
The timeframe matters just as much. A MACD crossover on a 5-minute chart describes very short-term momentum, while a crossover on a daily or weekly chart can mark a major shift in trend. Many traders check the MACD on a higher timeframe first to define the trend, then use a lower timeframe to time entries.
Combining MACD With Other Tools
The MACD works best as part of a broader strategy. Popular combinations include:
- RSI: use the RSI to spot overbought or oversold conditions and the MACD to confirm that momentum is actually turning.
- Moving averages: a 50 or 200-period moving average helps you only take MACD signals in the direction of the main trend.
- Support and resistance: a bullish MACD crossover that happens right at a support level carries more weight than one in the middle of a range.
- Volume: a crossover backed by rising volume shows real conviction behind the move.
Limitations of the MACD
The MACD is a powerful tool, but it has weaknesses traders should know:
- Lag: because it is built from moving averages, signals arrive after the move has already started. Sharp reversals can be partly missed.
- Whipsaws in sideways markets: in a range, the MACD and signal line cross repeatedly, generating many false signals.
- No overbought or oversold levels: since the MACD has no fixed range, it cannot be used like the RSI to spot extremes, and values cannot be compared across different assets.
Use the MACD alongside price action, trend context and solid risk management, not as a standalone trading system.
Setting Up a MACD Alert on TradingSignal
Watching charts all day for the next crossover is exhausting. With TradingSignal, creating a MACD alert is very easy: the app monitors the indicator for you and sends a notification the moment the MACD crosses its signal line. The "MACD cross the Signal" alert only requires five simple fields:
- Fast length: the period of the fast EMA (the classic value is 12).
- Slow length: the period of the slow EMA (the classic value is 26).
- Signal: the period of the signal line EMA (the classic value is 9).
- Condition: the type of crossover you want to catch, either the MACD line crossing above the signal line (bullish) or crossing below it (bearish).
- Interval: the candle timeframe to calculate the MACD on, from 1-minute charts up to daily charts (1m, 3m, 5m, 15m, 30m, 1h, 2h, 4h, 6h, 8h, 12h, or 1d).
Pick your pair, fill in those five fields, save your alert, and TradingSignal will notify you automatically as soon as the crossover happens, on any of the 1,500+ pairs available. No need to keep a chart open or calculate anything by hand.