Price reaches
When the price limit has been reached
Monitor 30+ indicators, get instant crypto alerts when the market is right for you.
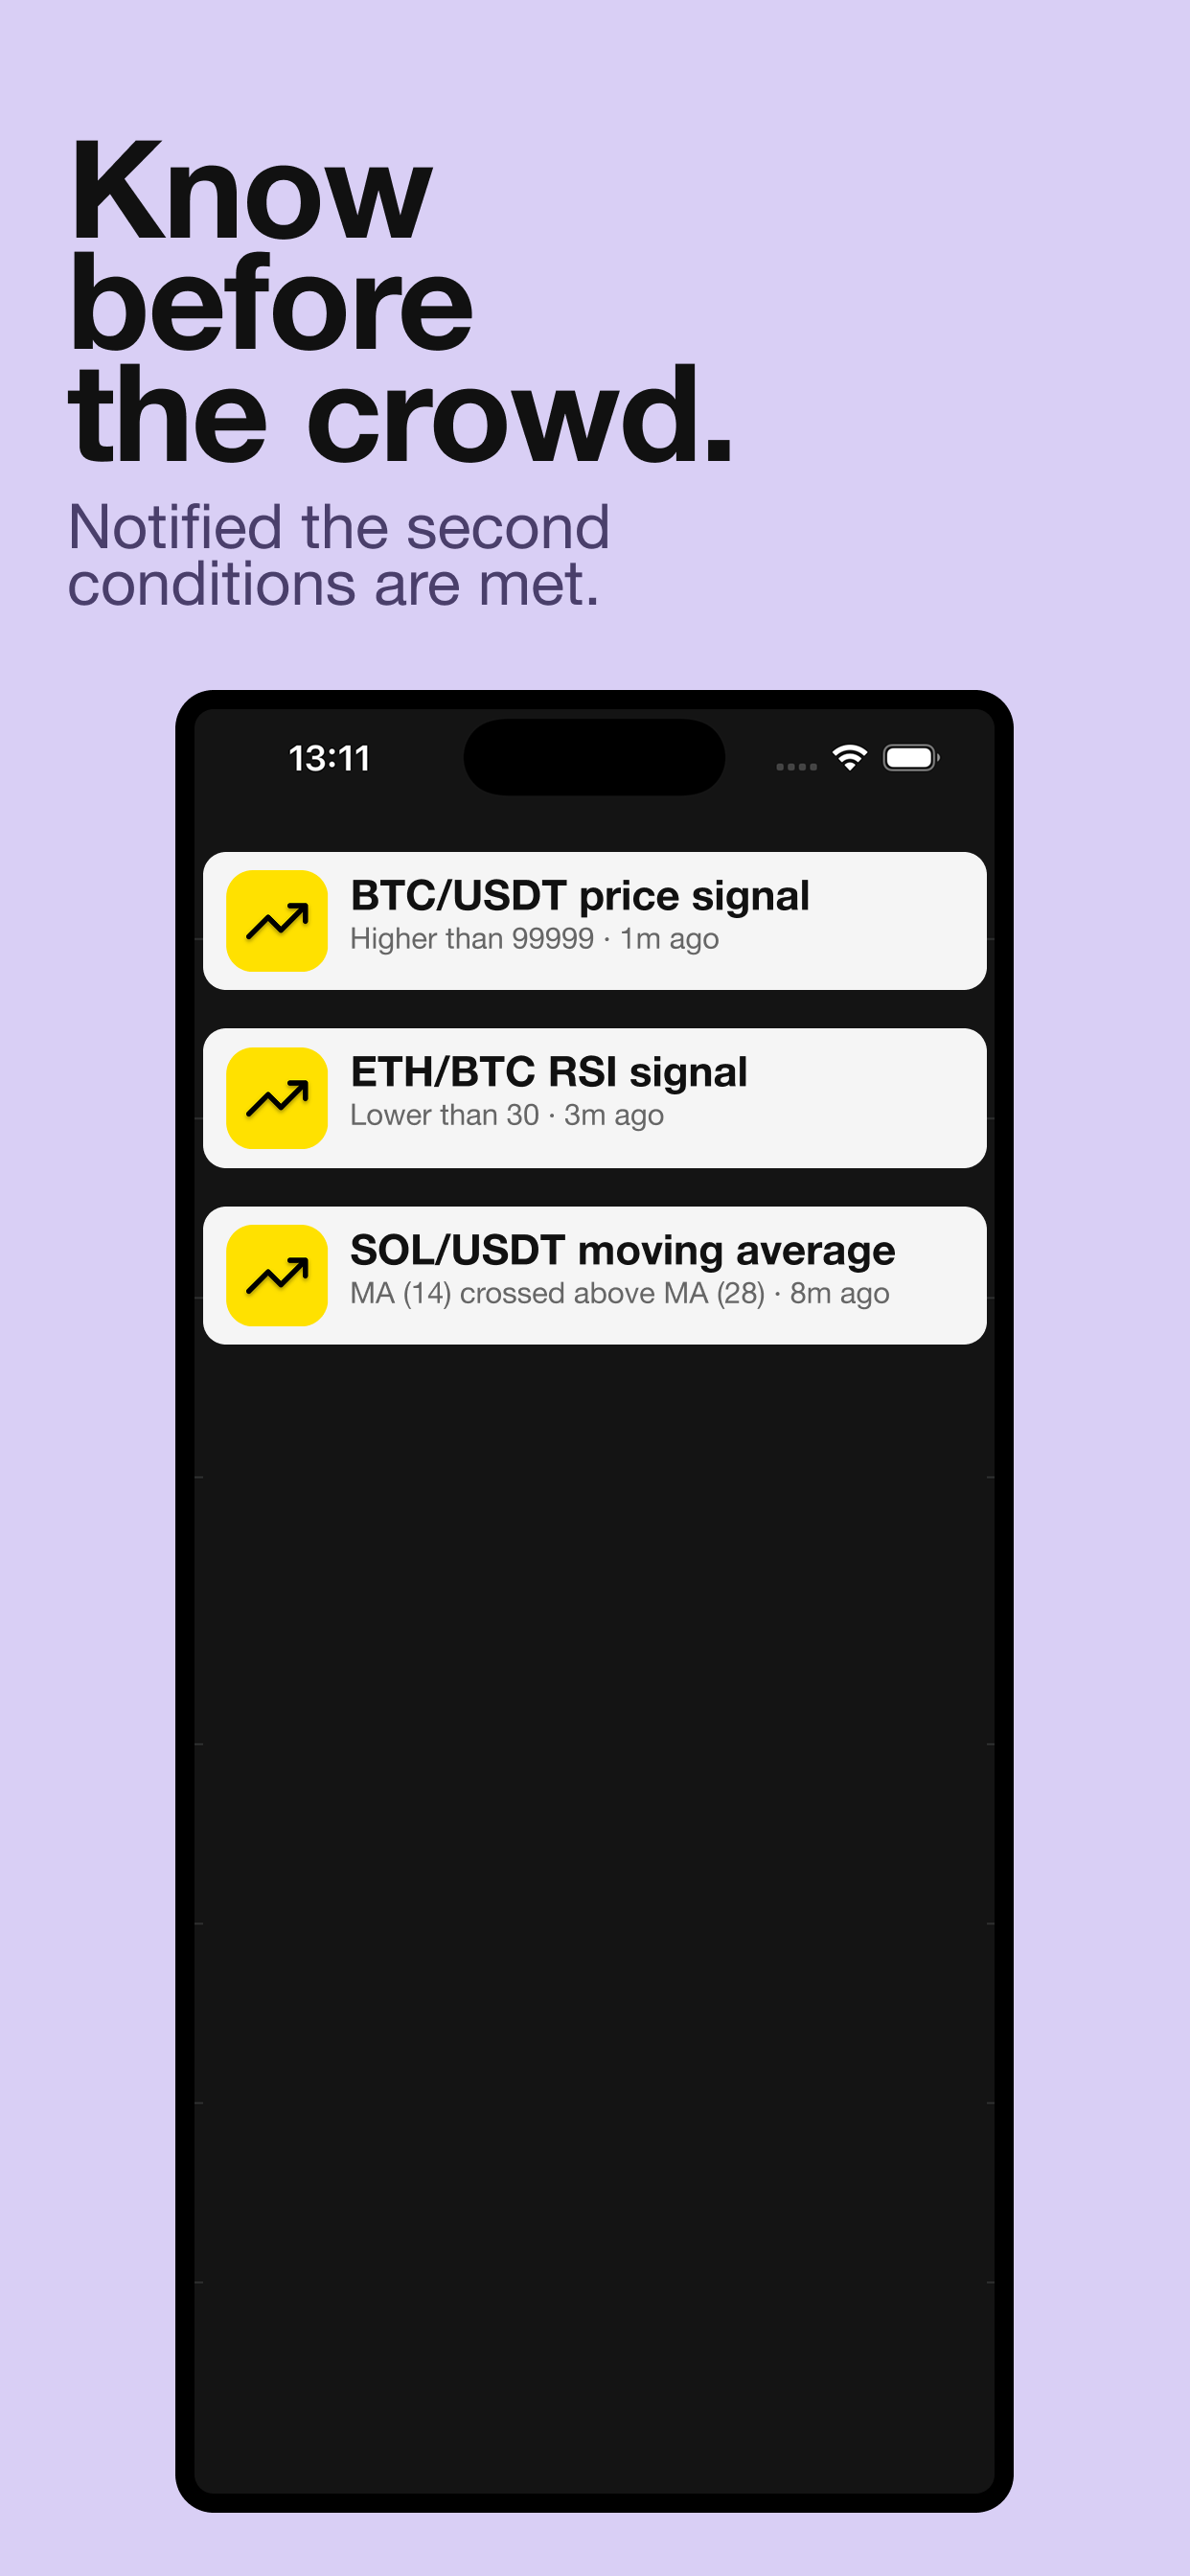
Get notified when price limits are reached
RSI, MACD, Super Trend, CCI, ADX and more
Doji, Shooting Star, Marubozu, candle colors
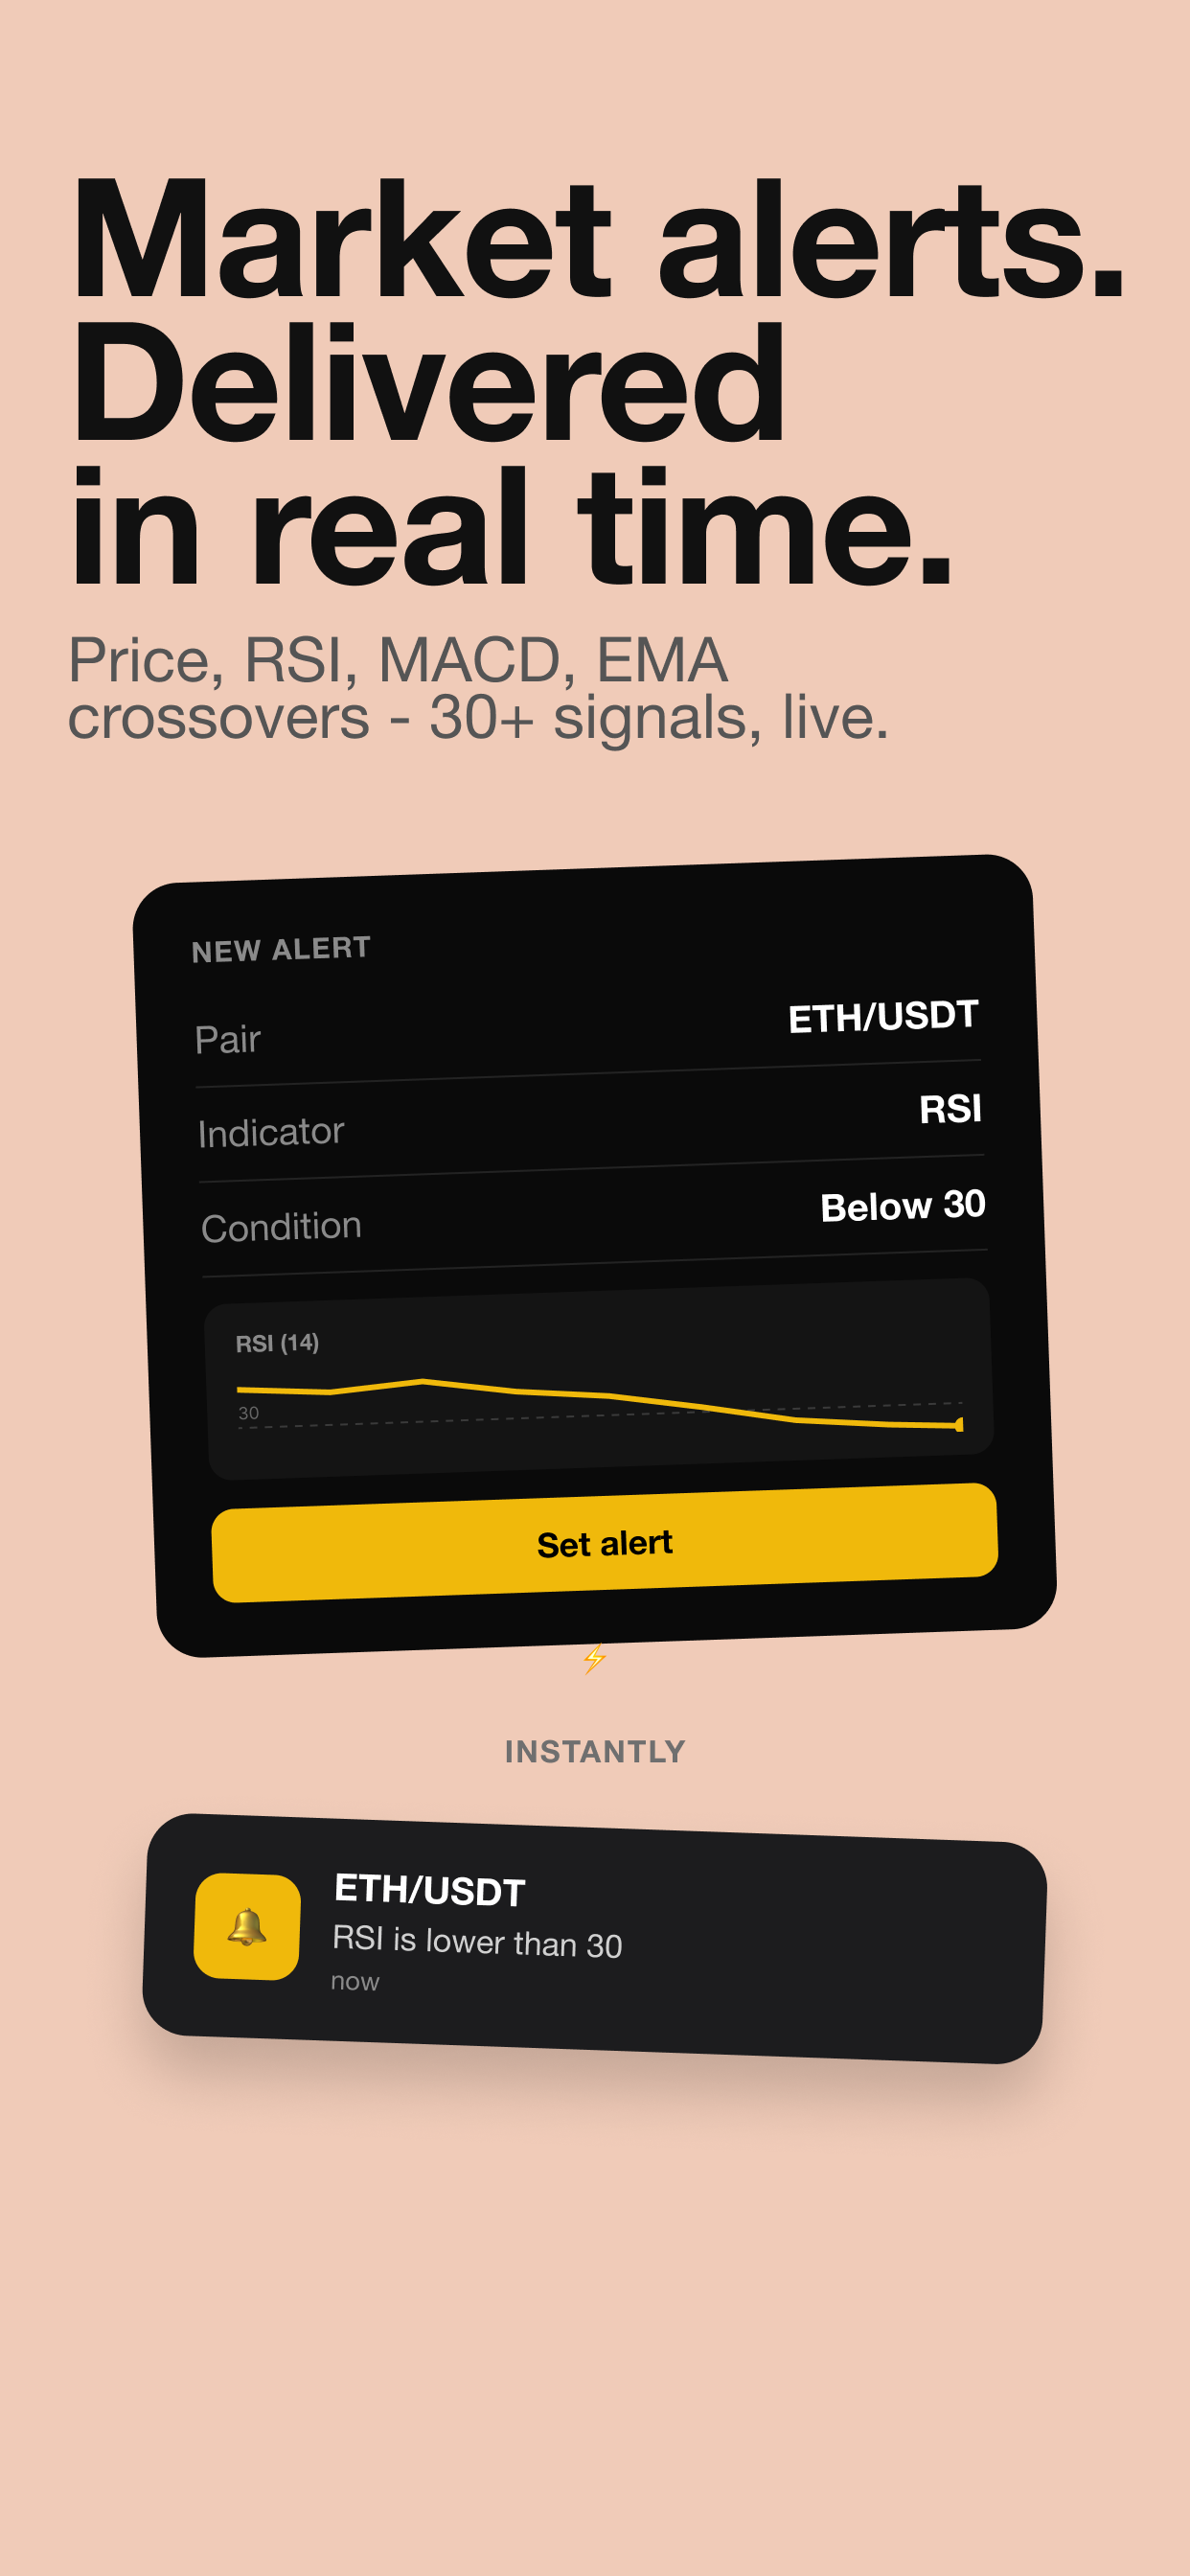
Instant alerts when conditions are met
Receive signals by email
Track volume changes on your pairs
Configure intervals from 1m to weekly
Binance, KuCoin and 1500+ pairs
React quickly to market opportunities
28+ signals
Price, volume, strategy tools, indicators, and candlestick patterns — pick what fits your setup.
When the price limit has been reached
When the price change from X%
When the volume change from X%
When the price touches a Fibonacci retracement level
When the price breaks above or below a recent range
When the volume exceeds a multiple of its recent average
When a Fair Value Gap forms, gets retested, or is filled
When price closes beyond the last swing high or swing low
When price closes beyond a swing against the prior market structure
When the price touches a support or resistance level from recent swings
When the price crosses above or bellow the Super Trend
When the price crosses above or bellow the Ichimoku Cloud
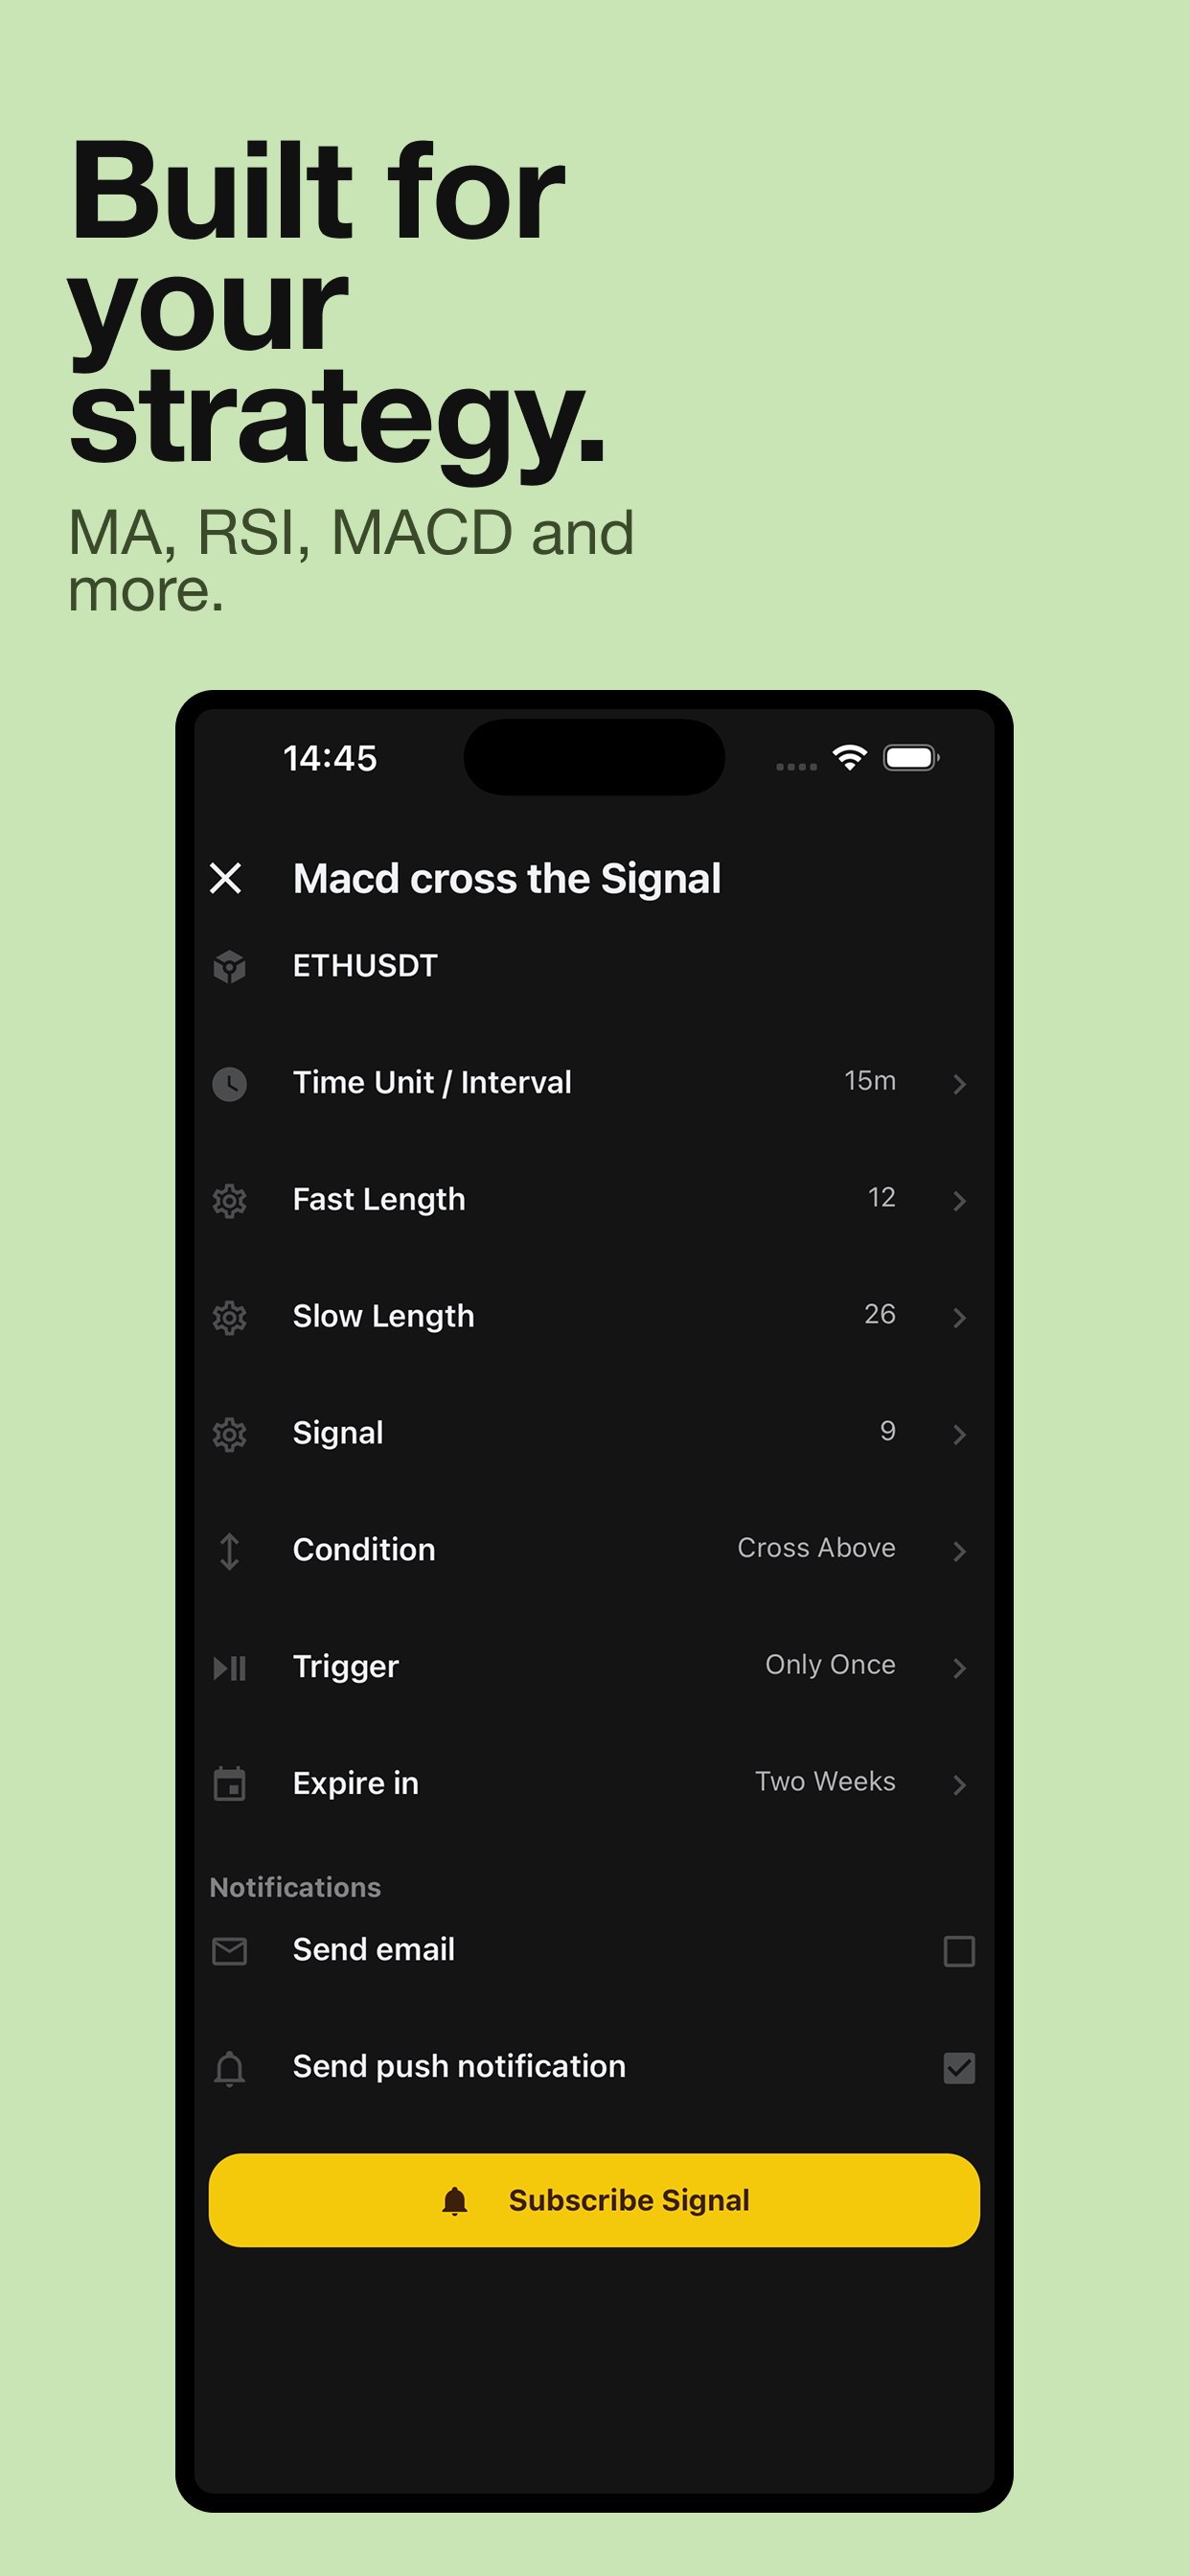
When the MACD crossover the signal line
When the Moving Average (MA) crossover the price
When the Moving Averages (MA) crossover each other
When the Exponential Moving Average (EMA) crossover the price
When the Exponential Moving Averages (EMA) crossover each other
When the price crosses above or bellow the Bollinger Bands
When the RSI is above or below a certain level
When the Stochastic RSI crosses above or below the D line
When the Commodity Channel Index (CCI) crosses above or below the set value
When the ADX crosses the value you have set
When the price forms a bullish or bearish Shooting Star pattern
When the price forms a bullish or bearish Doji pattern
When the price forms a bullish or bearish Marubozu pattern
When a candlestick color pattern is detected
When the price forms a bullish or bearish Hanging Man pattern
When the price forms a bullish or bearish Spinning Top pattern
Pick a pair, choose your indicator, set your condition — done. No need to stare at charts all day.
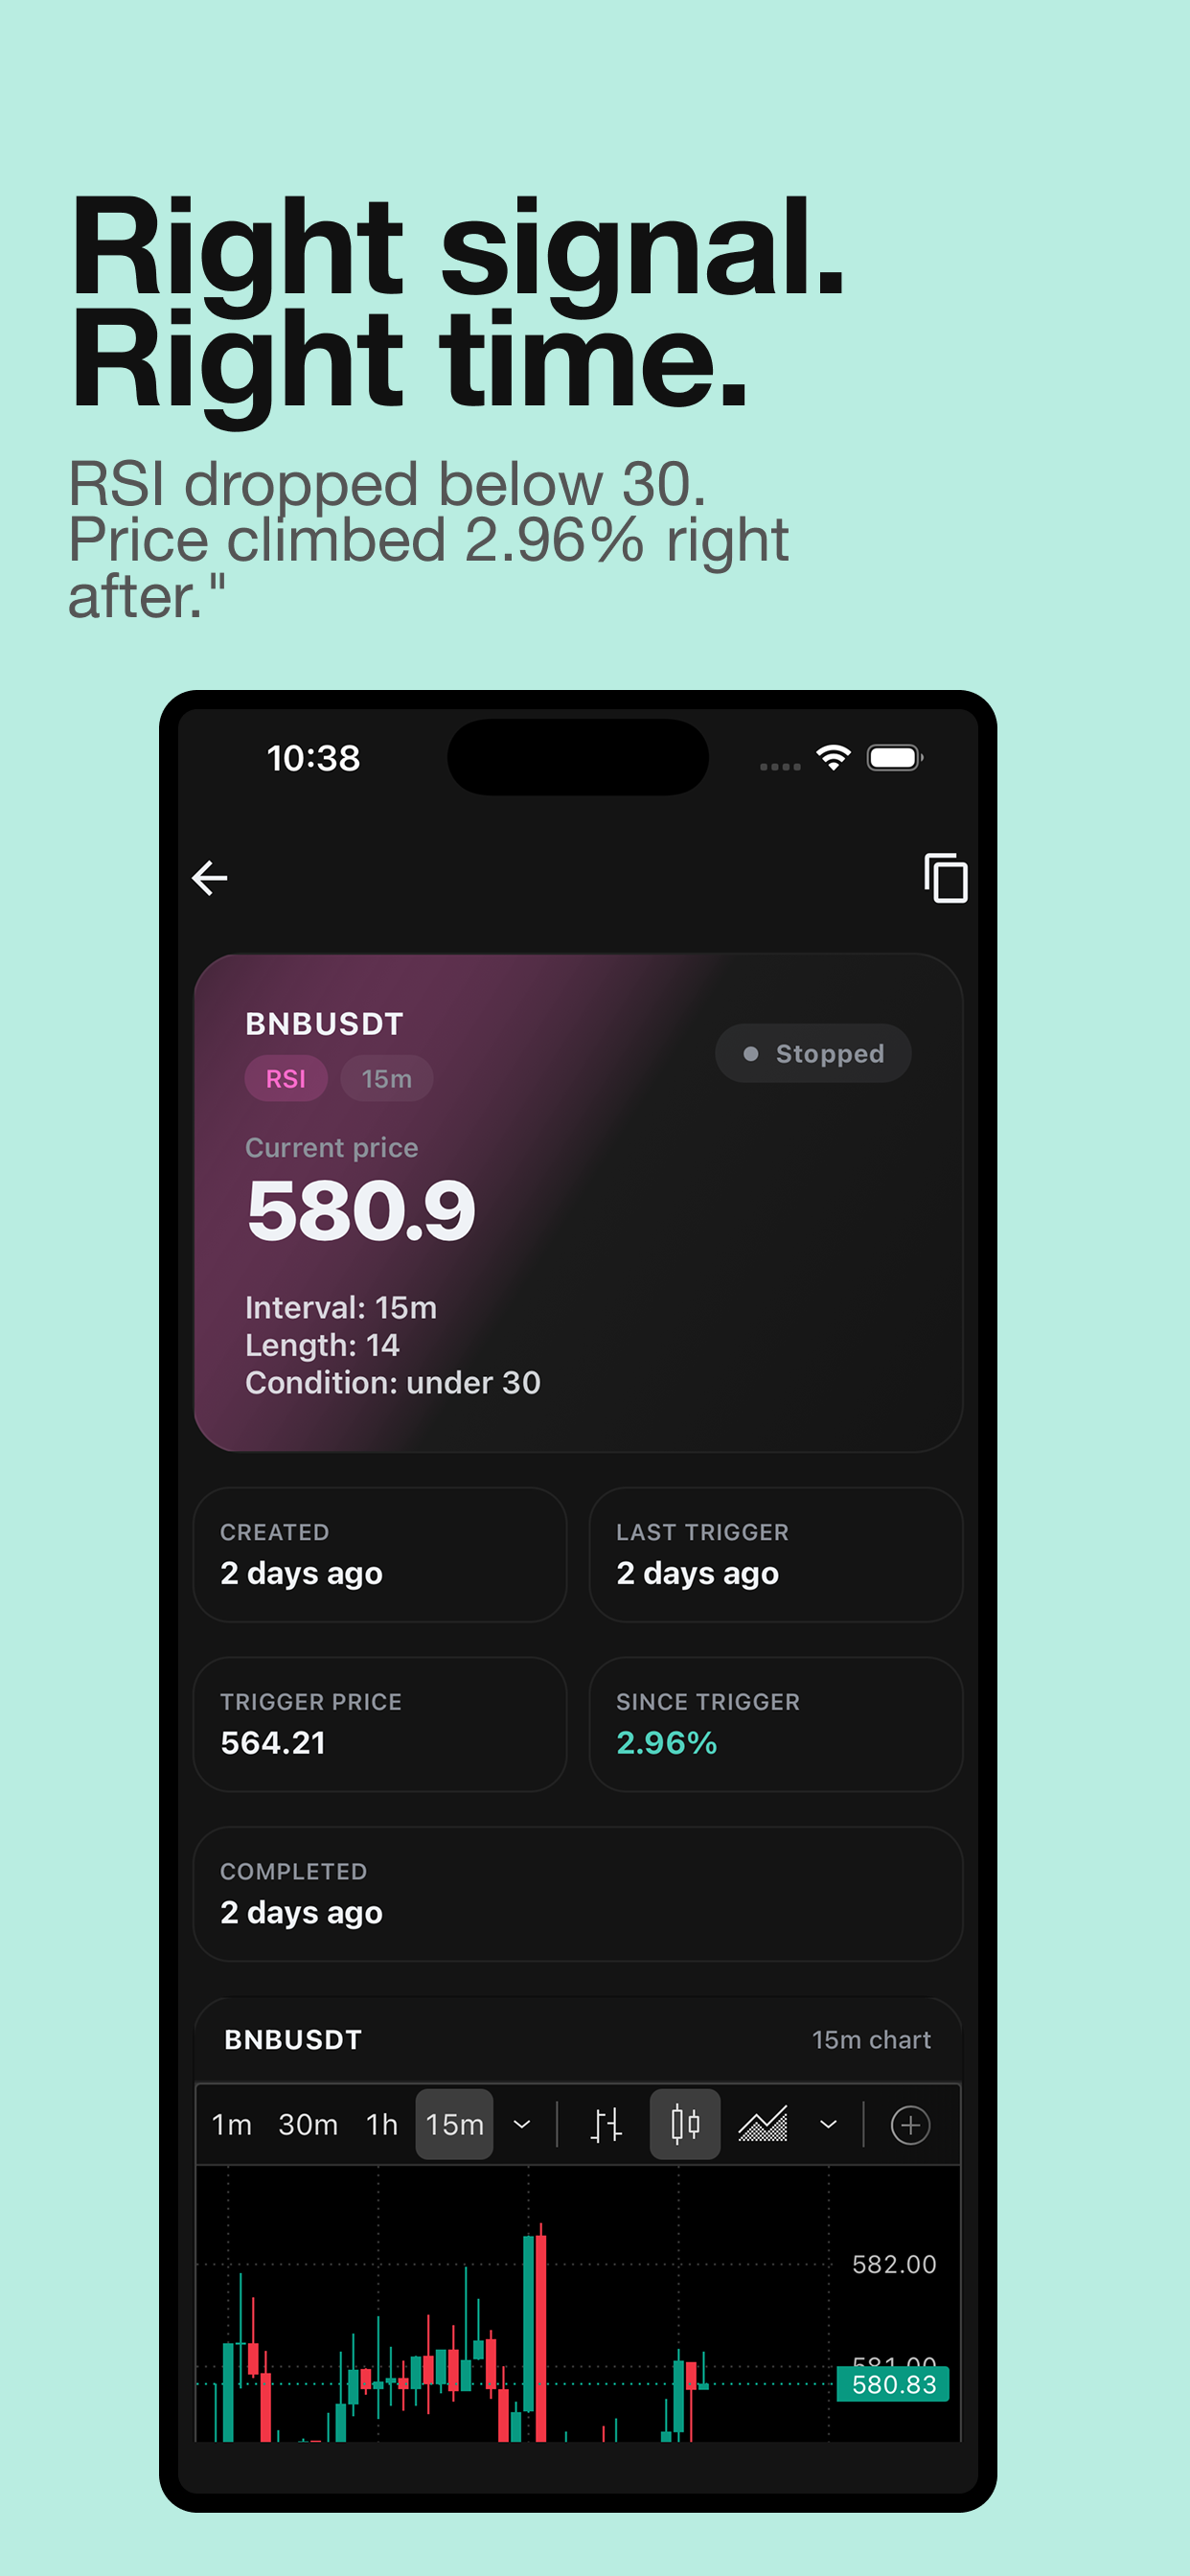
Review trigger price, elapsed time, and price movement since the signal fired — so you know if it was worth acting on.
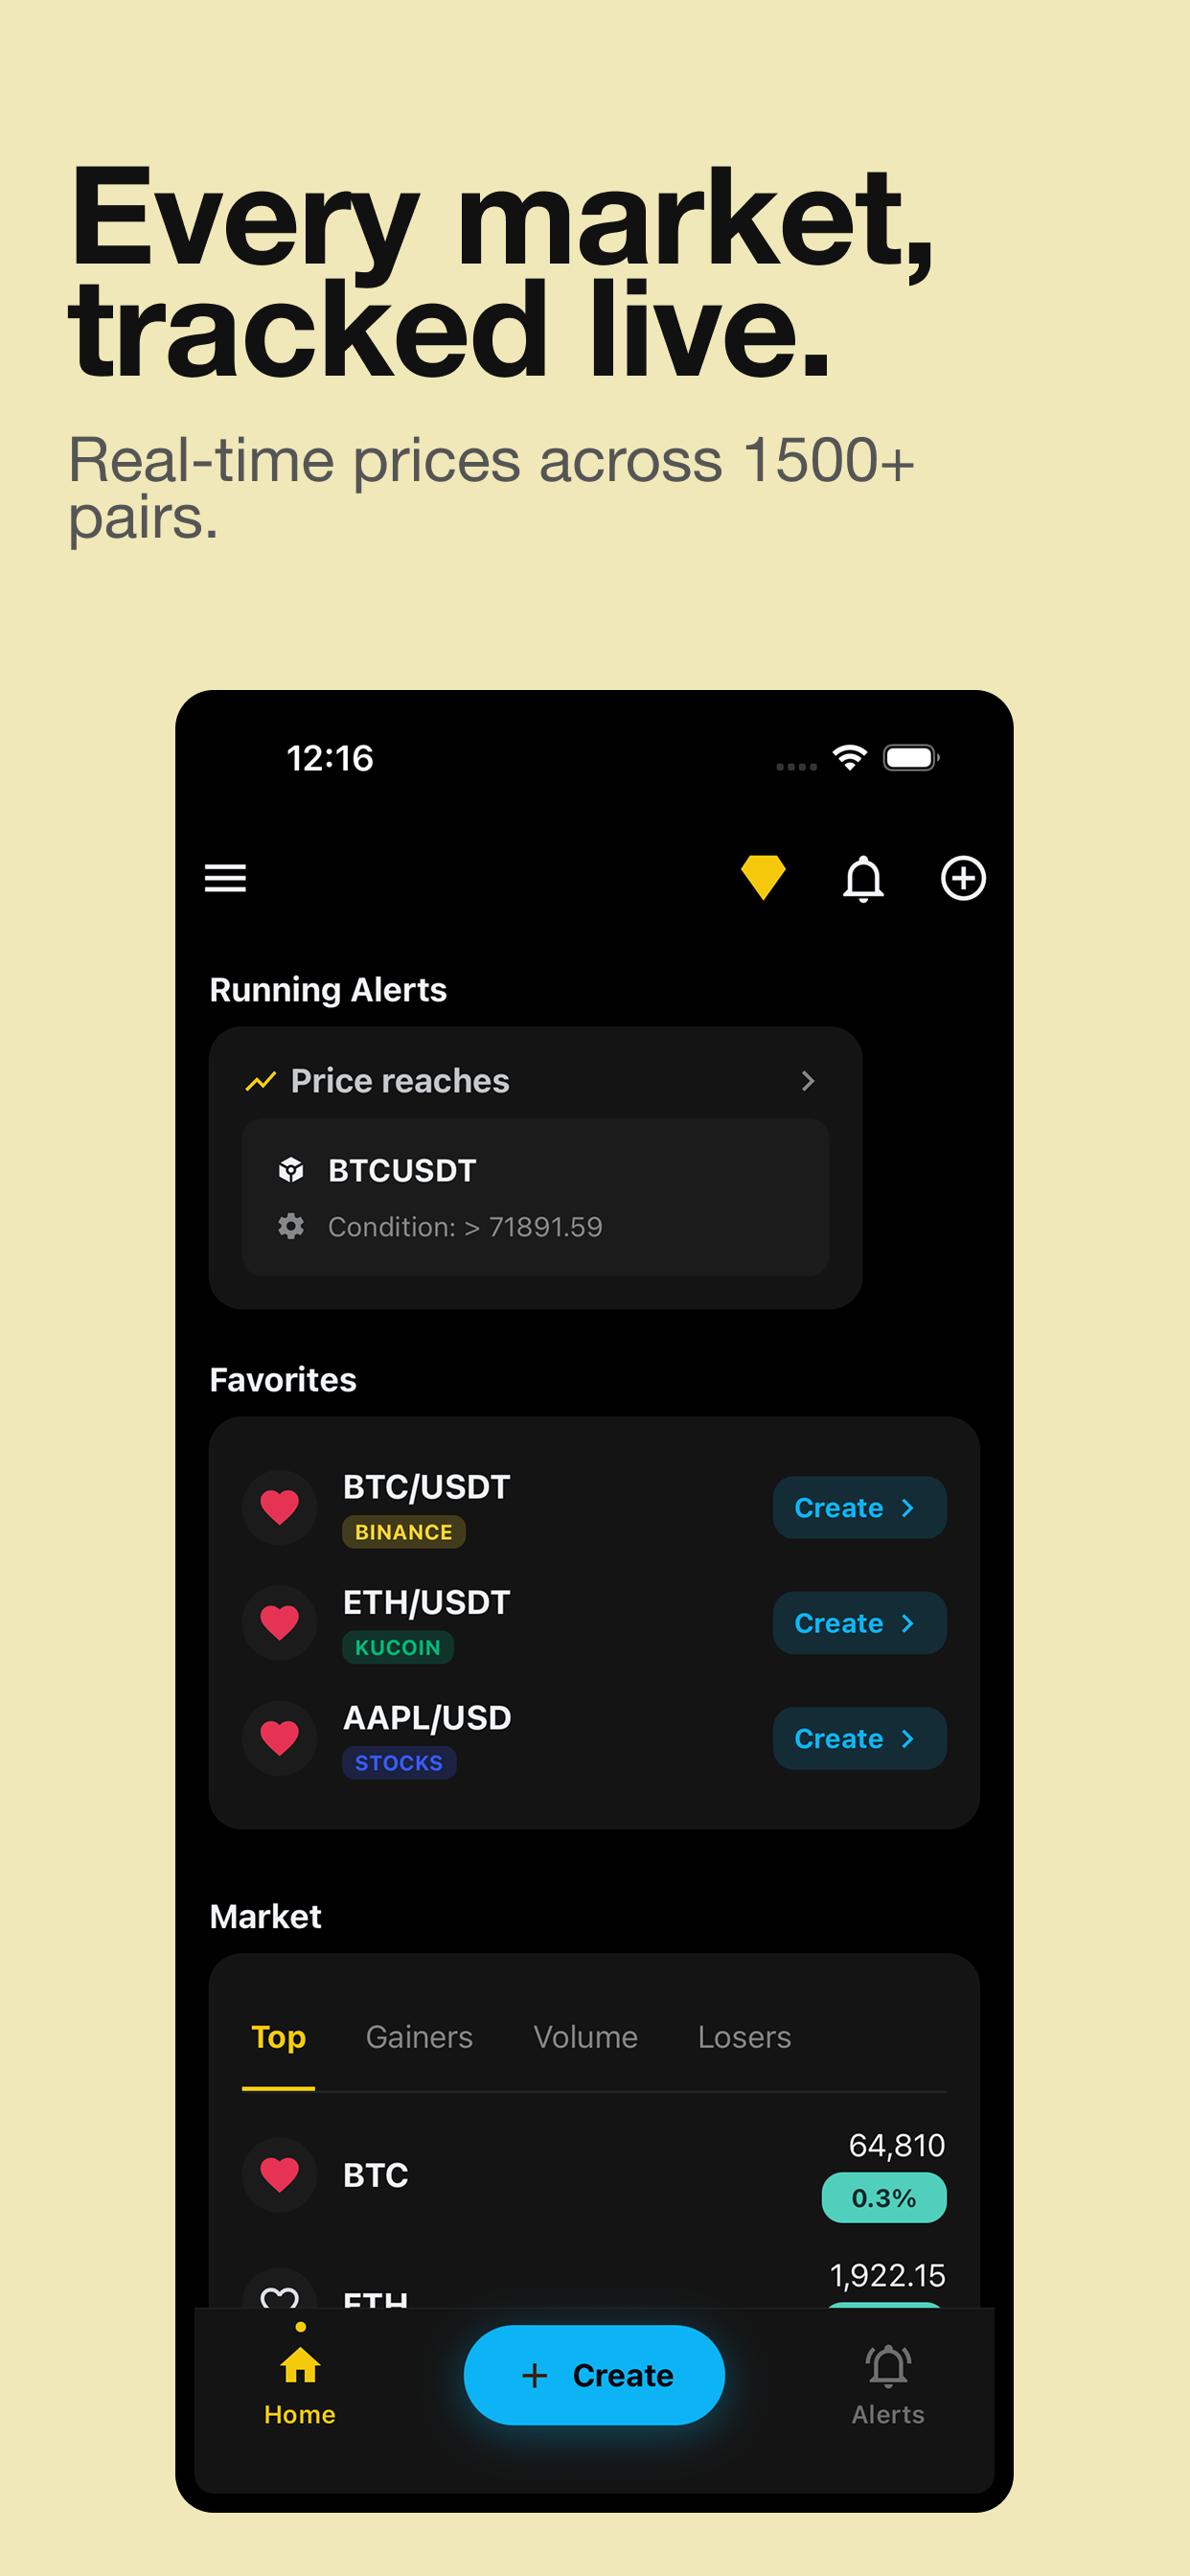
Running alerts, favorites, and top movers — everything you need without switching apps.
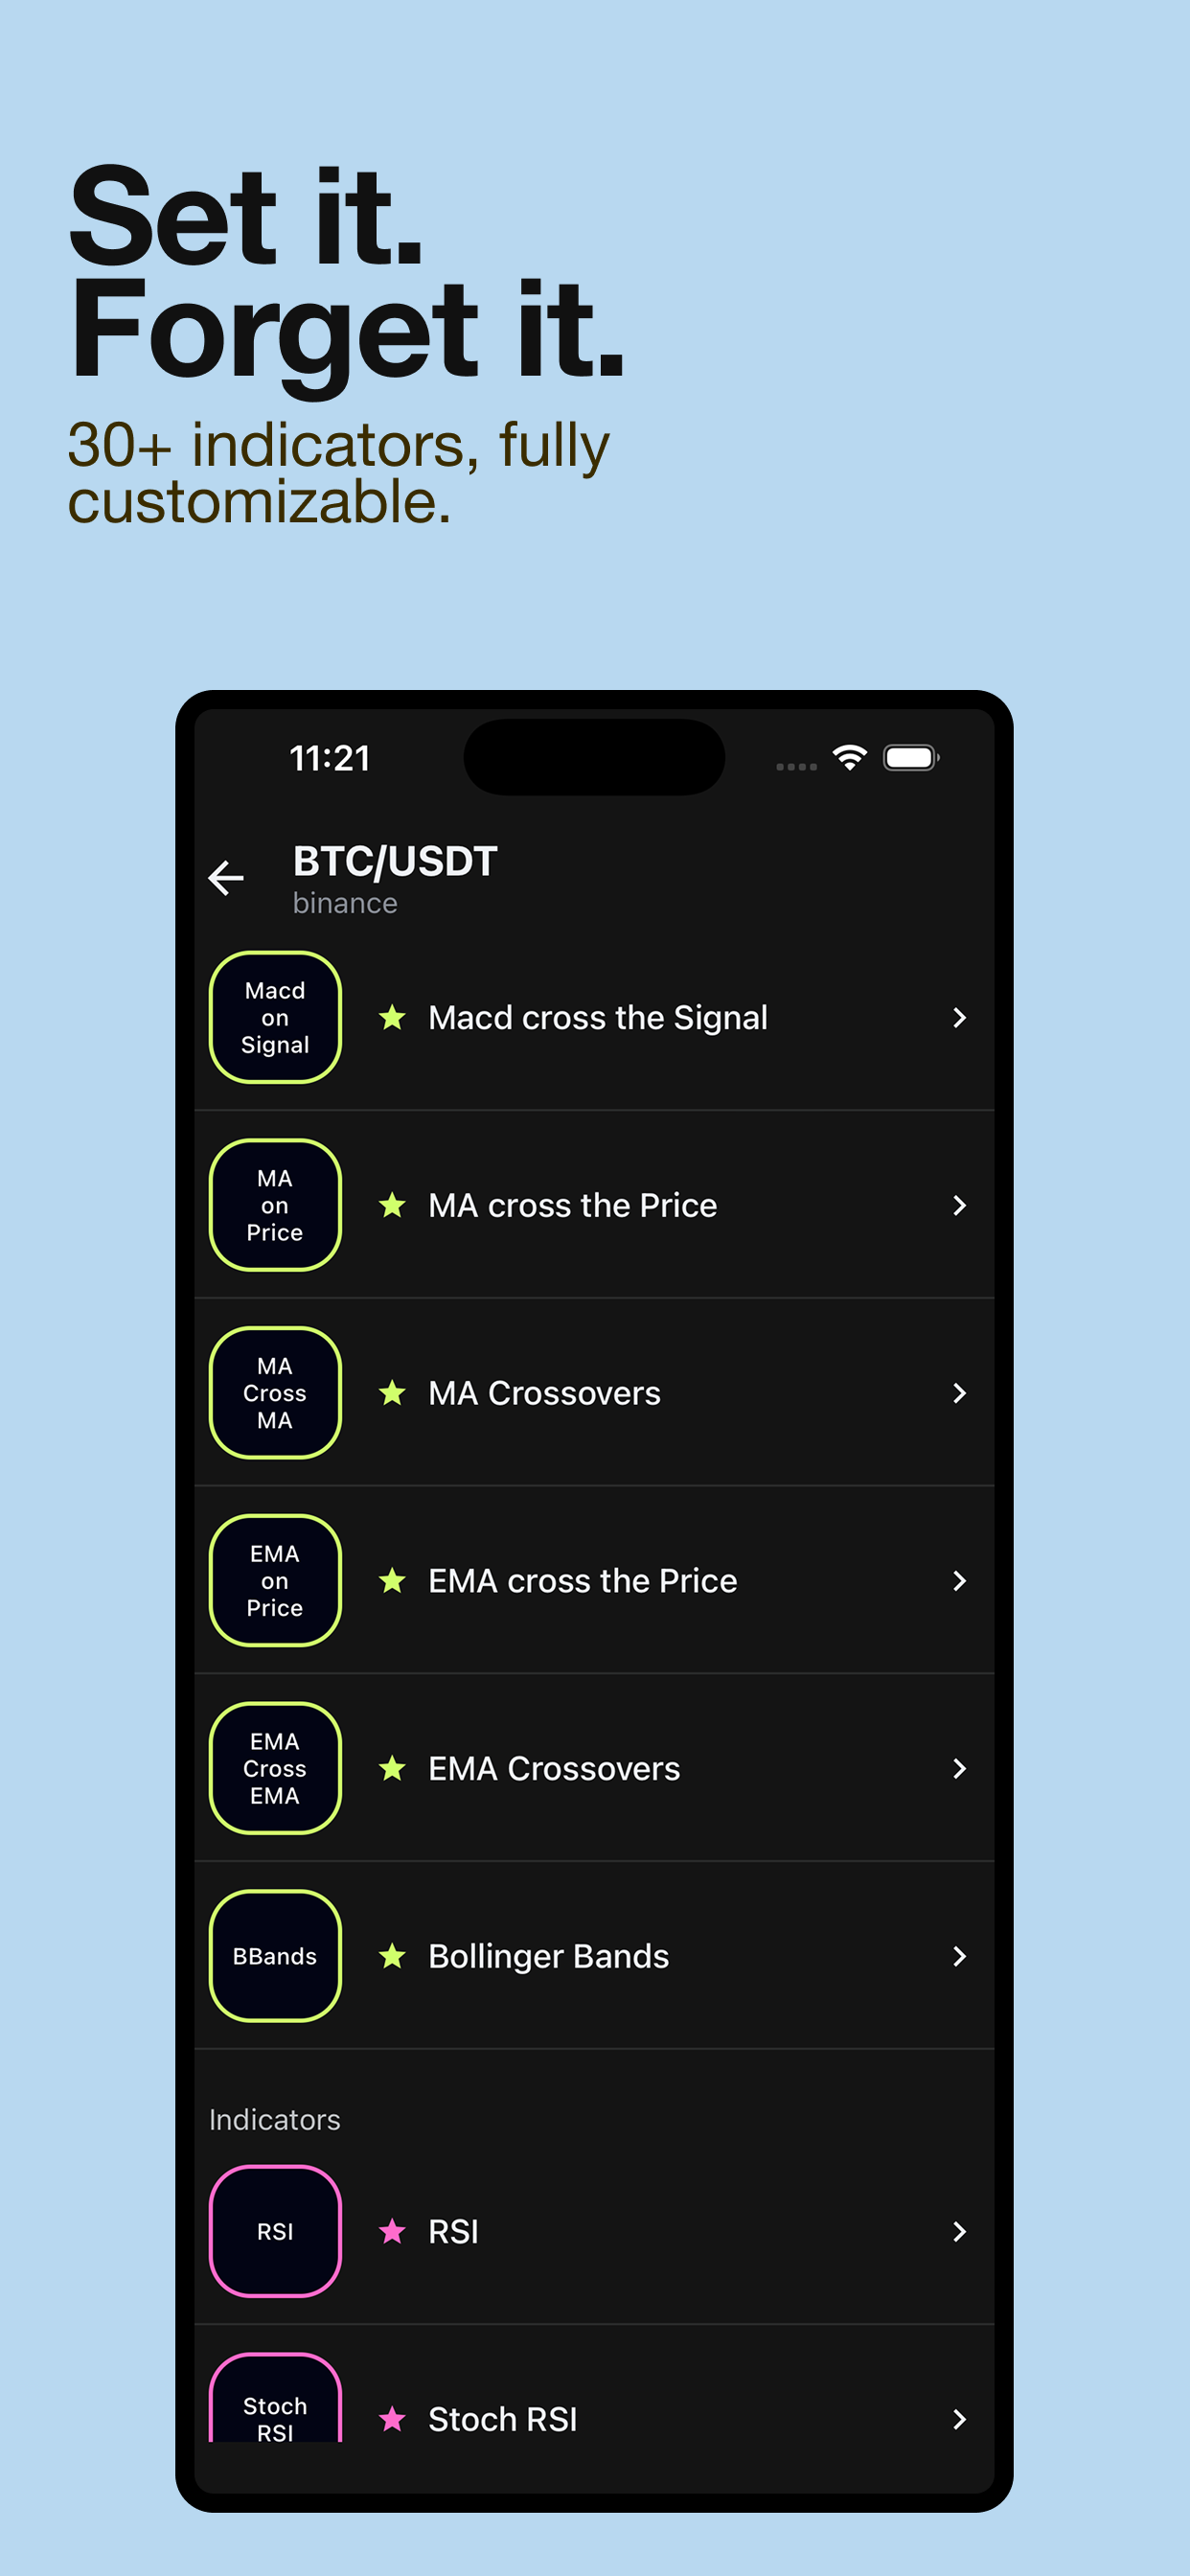
Price, volume, RSI, MACD, candlestick patterns, and multi-indicator combos — mix and match for any strategy.
Get pinged the moment your conditions hit — price breaks, RSI crosses, or MACD flips — on iOS and Android.
Set timeframes, indicator lengths, cross conditions, and whether alerts repeat or expire — built around how you trade.
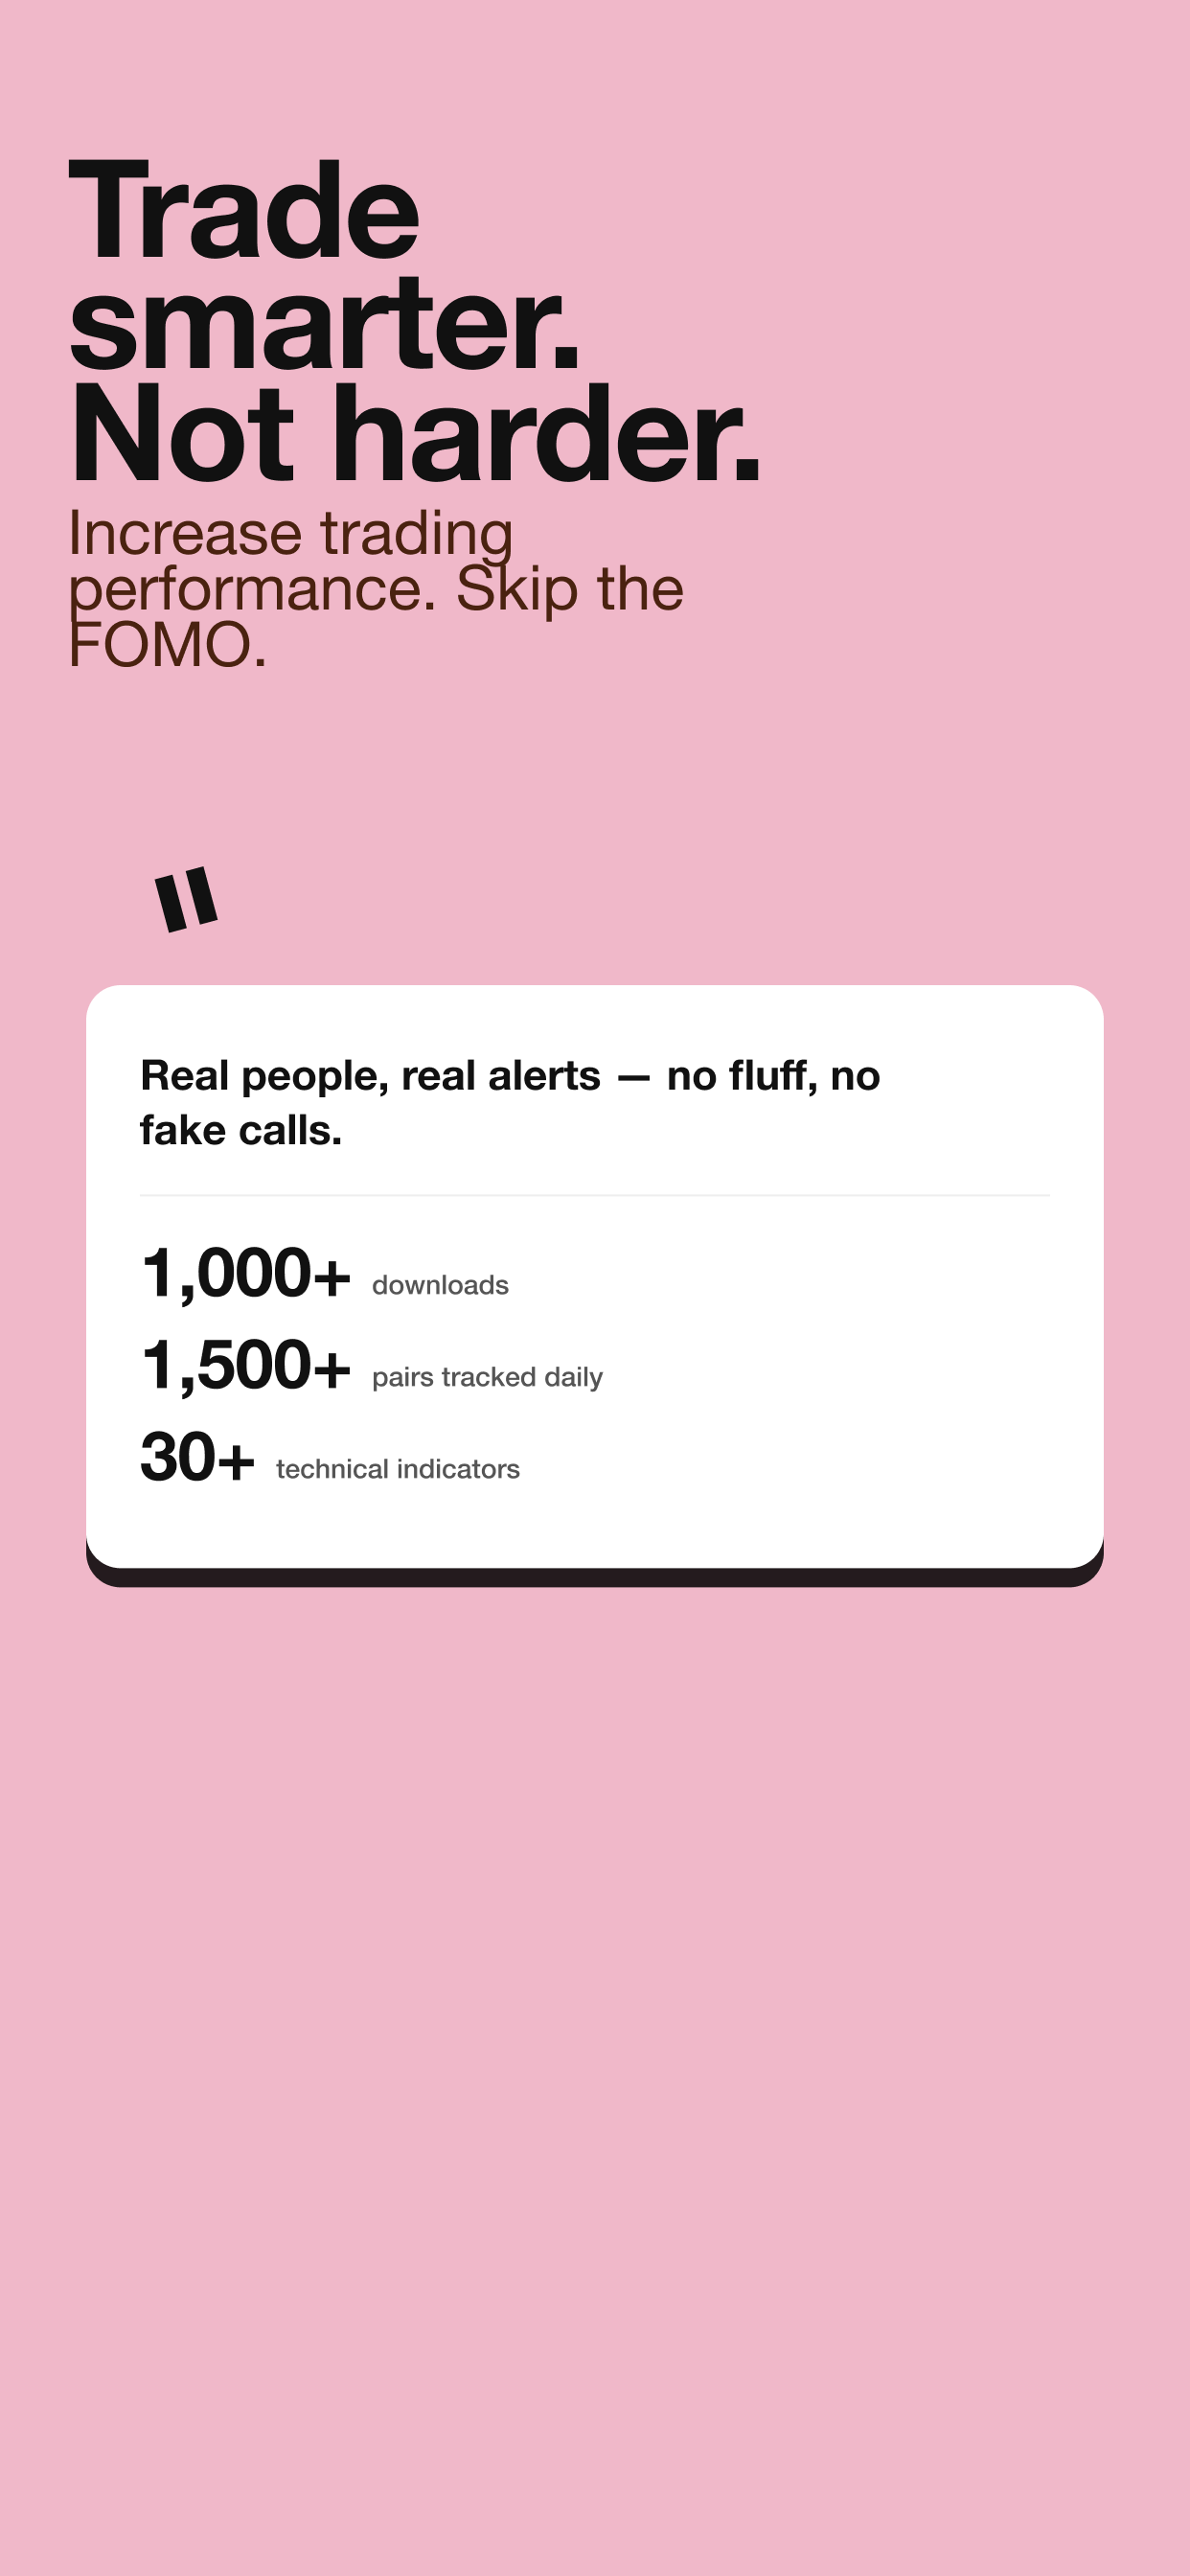
1,000+ downloads, 1,500+ pairs tracked daily, and 30+ technical indicators — real alerts, no noise.