RSI Indicator Explained: A Complete Guide to the Relative Strength Index
Sep 9, 2026
Learn what the RSI (Relative Strength Index) is, how it's calculated, how to read overbought and oversold signals, and how to set up an automatic RSI alert on TradingSignal.
The Relative Strength Index (RSI) is one of the most popular momentum indicators in technical analysis. Traders use it to measure the speed and size of recent price moves, helping to spot when an asset might be overbought, oversold, or about to change direction. This guide walks through everything you need to know about the RSI, from how it is calculated to how you can set up an automatic RSI alert on TradingSignal.
What Is the RSI Indicator?
The RSI was developed by J. Welles Wilder and introduced in his 1978 book "New Concepts in Technical Trading Systems." It is a momentum oscillator that moves on a scale from 0 to 100 and compares the magnitude of recent gains to recent losses over a chosen number of periods (commonly 14).
Because it is bound between 0 and 100, the RSI is easy to read at a glance: values near the top of the range suggest strong recent buying pressure, while values near the bottom suggest strong recent selling pressure.
How Is the RSI Calculated?
The RSI formula is based on the average gains and average losses over a given lookback period (the "length"):
- Average Gain: the average of all positive price changes over the period
- Average Loss: the average of all negative price changes over the period (expressed as a positive number)
- RS (Relative Strength) = Average Gain / Average Loss
- RSI = 100 − (100 / (1 + RS))
You don't need to calculate this by hand. Most charting platforms and tools like TradingSignal compute it automatically, but understanding the mechanics helps explain why the indicator behaves the way it does.
How to Read the RSI
The RSI is generally interpreted using three key zones:
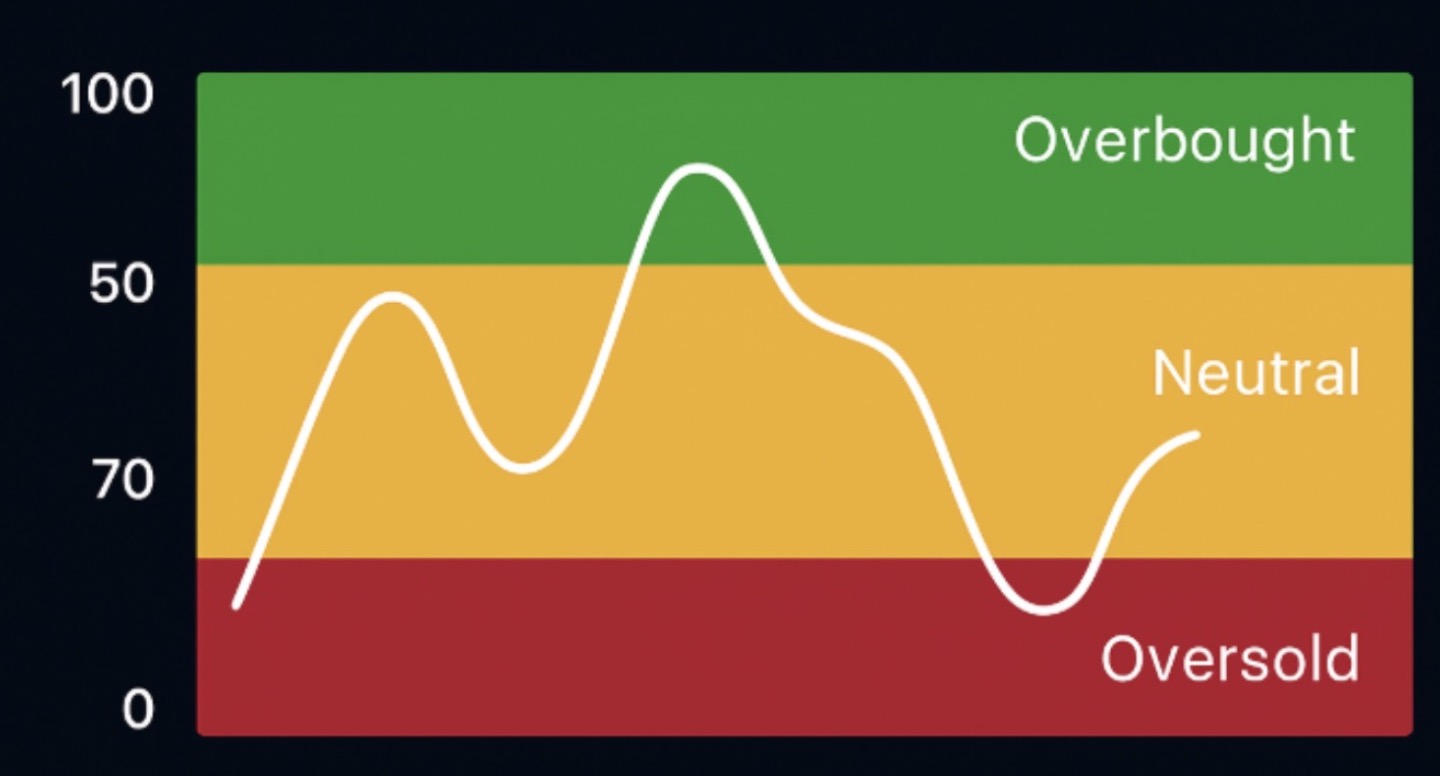
- Overbought (above 70): price has risen sharply and may be due for a pullback or consolidation.
- Oversold (below 30): price has fallen sharply and may be due for a bounce or reversal.
- Midline (around 50): a cross above 50 can signal building bullish momentum, while a cross below 50 can signal building bearish momentum.
Some traders use tighter or wider thresholds, such as 80/20, especially in strongly trending markets like crypto, where an asset can stay "overbought" for a long time while continuing to climb.
Choosing an RSI Length and Timeframe
The default RSI length is 14 periods, but it isn't a fixed rule. A shorter length (for example 7 or 9) makes the RSI more sensitive and reactive, producing more signals, some of which will be false. A longer length (for example 21 or 25) smooths the indicator out, producing fewer but generally more reliable signals.
The RSI can also be applied to any timeframe, from 1-minute charts for scalping to daily or weekly charts for long-term trend analysis. The right combination of length and timeframe depends on your trading style.
RSI Divergence
Divergence is one of the most powerful ways to use the RSI. It occurs when price and the RSI move in opposite directions:
- Bullish divergence: price makes a lower low, but the RSI makes a higher low. This can signal weakening downward momentum and a possible reversal to the upside.
- Bearish divergence: price makes a higher high, but the RSI makes a lower high. This can signal weakening upward momentum and a possible reversal to the downside.
Divergence doesn't guarantee a reversal. It is a warning sign that momentum is shifting, and is best combined with other confirmation signals.
RSI Failure Swings
A failure swing is another classic RSI signal, independent of price action. A bullish failure swing happens when the RSI dips below 30, bounces back above 30, pulls back without going below 30 again, and then breaks above its prior high. The bearish version is the mirror image at the top of the range. Because failure swings rely only on the RSI's own shape, some traders see them as a cleaner confirmation tool than price-based divergence.
Combining RSI With Other Tools
Like any indicator, RSI works best as part of a broader strategy rather than in isolation. Common combinations include:
- Trend indicators (moving averages, MACD) to confirm the overall direction before acting on an RSI signal.
- Support and resistance levels to see if an overbought or oversold RSI reading lines up with a key price zone.
- Volume to check whether a move accompanied by an extreme RSI reading is backed by real conviction.
Limitations of the RSI
The RSI is not a perfect predictor, and traders should keep a few limitations in mind:
- In strong trends, the RSI can stay overbought or oversold for extended periods without price reversing.
- Like all momentum indicators, it can produce false signals in choppy or low-liquidity markets.
- It works best as a confirmation tool alongside price action, trend context, and risk management, not as a standalone trading system.
Setting Up an RSI Alert on TradingSignal
One of the easiest ways to put the RSI to work is to let TradingSignal watch it for you instead of staring at charts all day. Creating an RSI alert on the platform only requires four simple fields:
- Level: the RSI value you want to watch, anywhere between 0 and 100 (for example 70 for overbought or 30 for oversold).
- Length: the number of periods used to calculate the RSI (the classic setting is 14, but any value works).
- Condition: how you want the current RSI to compare to your chosen level (for example, above, below, or crossing it).
- Interval: the candle timeframe to calculate the RSI on, from 1-minute charts up to daily charts (1m, 3m, 5m, 15m, 30m, 1h, 2h, 4h, 6h, 8h, 12h, or 1d).
Fill in those four fields, save your alert, and TradingSignal will notify you automatically the moment the RSI meets your condition, no need to keep a chart open or calculate anything by hand.