Bollinger Bands Explained: A Complete Guide to Volatility Trading
Sep 23, 2026
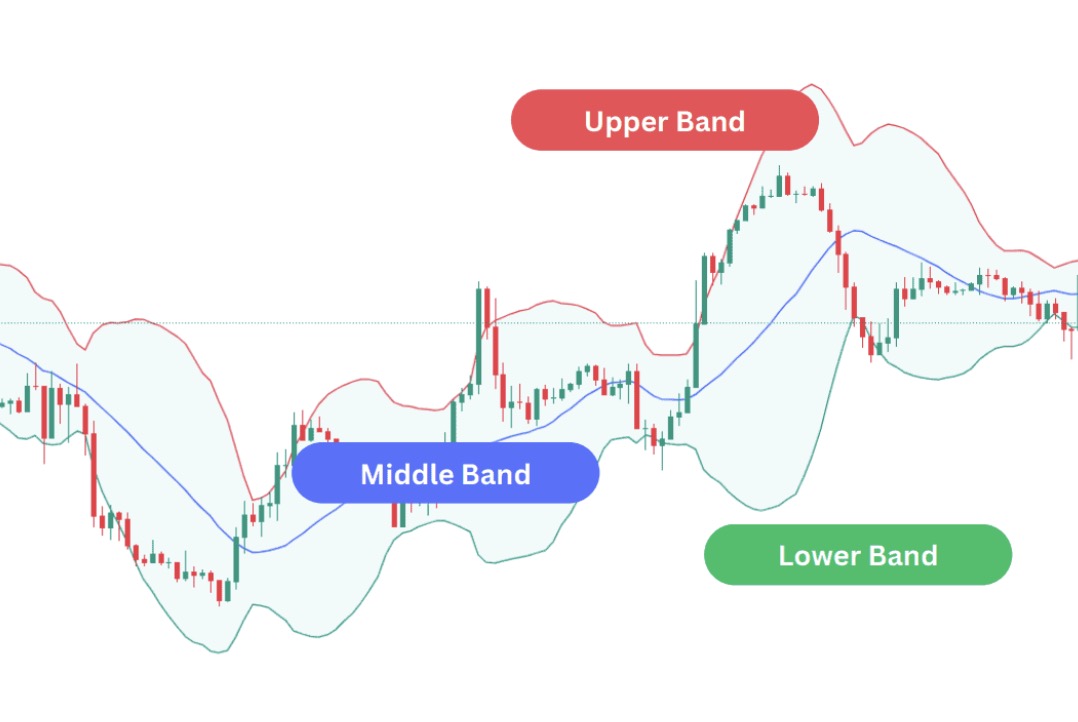
Learn what Bollinger Bands are, how they're calculated, how to read the squeeze, band walks and band touches, and how to set up an automatic Bollinger Bands alert on TradingSignal.
Bollinger Bands are one of the most popular volatility indicators in technical analysis. They wrap price in a dynamic channel that widens when the market gets volatile and tightens when it calms down, helping traders spot potential breakouts, reversals and overextended moves. This guide explains what Bollinger Bands are, how they are calculated, how to read the most common signals (the squeeze, band walks and band touches), and how to set up an automatic Bollinger Bands alert on TradingSignal.
What Are Bollinger Bands?
Bollinger Bands were created by John Bollinger in the 1980s. The indicator is plotted directly on the price chart and is made of three lines:
- The middle band: a simple moving average (SMA) of price, usually over 20 periods.
- The upper band: the middle band plus a multiple of the standard deviation (usually 2).
- The lower band: the middle band minus the same multiple of the standard deviation.
Because standard deviation measures how far prices are spread from their average, the bands automatically adapt to market conditions. In calm markets they contract; in volatile markets they expand. Statistically, with the default settings, most price action tends to stay inside the bands, which is why moves outside them attract so much attention.
How Are Bollinger Bands Calculated?
Bollinger Bands use two settings, commonly written as BB(20, 2):
- Length (20): the number of periods used for the moving average and the standard deviation.
- Standard deviation multiplier (2): how far the outer bands sit from the middle band.
The formulas are:
- Middle band = SMA(20) of the closing price
- Upper band = Middle band + (2 × standard deviation of the last 20 closes)
- Lower band = Middle band − (2 × standard deviation of the last 20 closes)
You don't need to calculate any of this by hand. Charting platforms and tools like TradingSignal compute the bands automatically, but understanding the formula explains why the bands react to volatility rather than to direction.
How to Read Bollinger Bands
Price Touching or Crossing the Bands
When price reaches the upper band, it is trading at the high end of its recent range. When it reaches the lower band, it is trading at the low end. In a range-bound market, many traders see:
- A touch or close below the lower band as a sign that price may be stretched to the downside and due for a bounce.
- A touch or close above the upper band as a sign that price may be stretched to the upside and due for a pullback.
A band touch is not a buy or sell signal on its own. It simply tells you that price is relatively high or low compared to its recent average, and works best when combined with other confirmation.
The Bollinger Squeeze
The squeeze is one of the most famous Bollinger Bands setups. When volatility drops, the bands contract tightly around price. Periods of low volatility are often followed by periods of high volatility, so a squeeze can signal that a strong move is coming. Traders then watch for price to break decisively above the upper band (bullish breakout) or below the lower band (bearish breakdown) as the bands start expanding again.
The squeeze tells you that a move may be coming, not in which direction. Volume, trend context and the direction of the breakout candle help confirm it.
Walking the Bands
In strong trends, price can "walk" along one band for a long time. In a powerful uptrend, candles repeatedly close near or above the upper band; in a strong downtrend, they hug the lower band. This is a sign of strength, not an automatic reversal signal. Trying to short every touch of the upper band during a band walk is one of the most common mistakes traders make with this indicator.
The Middle Band as Dynamic Support and Resistance
The 20-period middle band often acts as dynamic support in an uptrend and dynamic resistance in a downtrend. Pullbacks to the middle band that hold can offer entries in the direction of the trend, while a clean break through it can be an early warning that momentum is shifting.
Bollinger Bands Reversal Patterns: W-Bottoms and M-Tops
John Bollinger also described classic reversal patterns built around the bands:
- W-bottom: price makes a first low outside or at the lower band, bounces, then makes a second low that stays inside the lower band. The weaker second push down suggests selling pressure is fading and a bullish reversal may follow.
- M-top: price makes a first high at or above the upper band, pulls back, then makes a second high that fails to reach the upper band. The weaker second push up suggests buying pressure is fading and a bearish reversal may follow.
These patterns work like divergence: they show momentum weakening even when price revisits similar levels.
Choosing Bollinger Bands Settings and Timeframe
The classic 20, 2 settings work well for most markets, but they can be adjusted:
- Shorter length (for example 10 with a 1.5 multiplier) makes the bands follow price more closely, producing more touches and more signals, many of them noise.
- Longer length (for example 50 with a 2.5 multiplier) smooths the bands, producing fewer but more significant signals, which suits swing and position trading.
The timeframe matters too. Bollinger Bands on a 5-minute chart describe very short-term volatility, while on a daily or weekly chart they frame the bigger picture. Crypto markets are often more volatile than traditional assets, so some traders use a slightly wider multiplier to reduce false signals.
Combining Bollinger Bands With Other Tools
Bollinger Bands measure volatility and relative price level, so they pair well with momentum and trend tools:
- RSI: a lower band touch combined with an oversold RSI reading is a stronger bounce signal than either one alone. The same goes for an upper band touch with an overbought RSI.
- MACD: after a squeeze, a MACD crossover in the direction of the breakout helps confirm that momentum is behind the move.
- Volume: a breakout from a squeeze on rising volume is far more reliable than one on weak volume.
- Support and resistance: band touches that line up with key horizontal levels carry more weight.
Limitations of Bollinger Bands
Bollinger Bands are versatile, but they have limits traders should keep in mind:
- Not a standalone signal: touching a band does not mean price must reverse, especially in trending markets.
- No direction on squeezes: a squeeze warns of a volatility expansion but does not tell you which way price will go.
- Lagging: the bands are built from a moving average and past volatility, so they react after price has moved.
- False breakouts: in choppy markets, price can poke outside the bands and immediately return inside.
Use Bollinger Bands alongside price action, trend context and solid risk management, not as a complete trading system on their own.
Setting Up a Bollinger Bands Alert on TradingSignal
Watching charts all day for a band break or a squeeze breakout is exhausting. With TradingSignal, creating a Bollinger Bands alert is very easy: the app monitors the bands for you and sends a notification the moment price crosses above or below them. Setting it up only takes a few seconds:
- Pair: choose the market you want to watch among 1,500+ pairs on Binance, KuCoin and more.
- Bollinger Bands settings: keep the classic 20-period length and 2 standard deviations, or adjust them to fit your strategy.
- Condition: choose whether you want to be alerted when price crosses above the upper band or below the lower band.
- Interval: the candle timeframe to calculate the bands on, from 1-minute charts up to daily charts.
Save your alert and TradingSignal will notify you automatically, by push notification or email, as soon as price breaks out of the bands. No need to keep a chart open or calculate anything by hand.