Candle Color Sequence Explained: How to Read Consecutive Green and Red Candles in Crypto
Oct 20, 2026
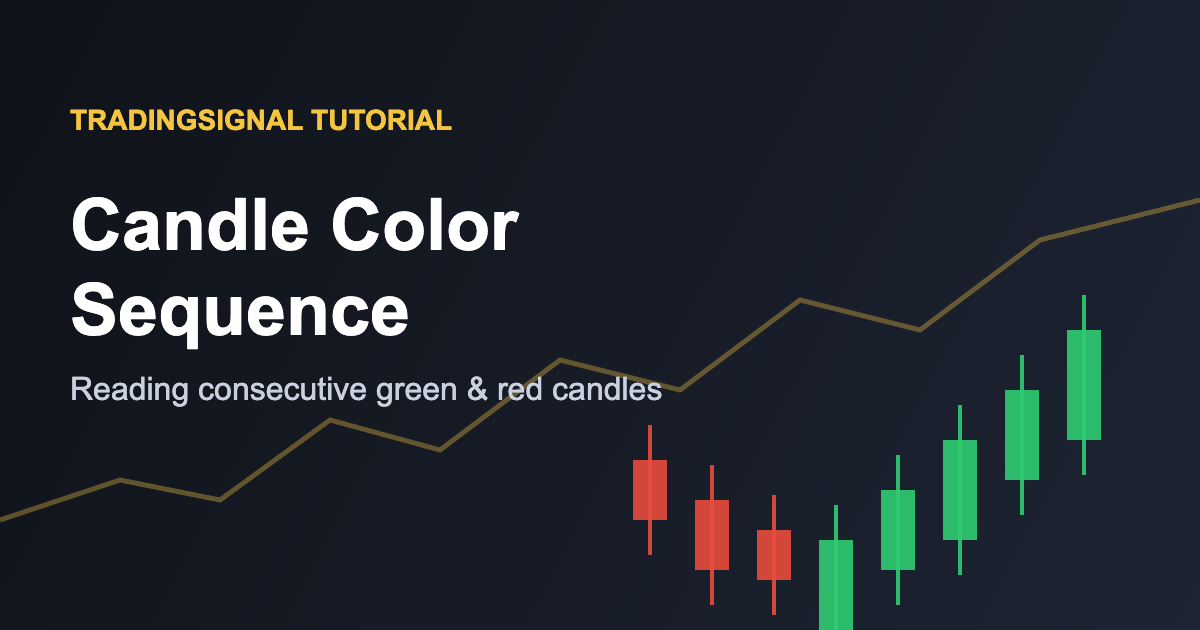
Learn how candle color sequences work in crypto, what a streak of consecutive green or red candles really tells you, how to tune the streak length for each timeframe, and how to set up a candle color alert on TradingSignal.
Before RSI, MACD or any other indicator existed, traders read the market by looking at one simple thing: the color of the candles. A green candle means buyers closed the period higher than it opened, a red candle means sellers pushed it lower. When several candles of the same color appear in a row, the market is telling you something about momentum. This guide explains how to read candle color sequences in crypto, how to tune them, and how to turn them into automatic alerts.
What Is a Candle Color Sequence?
A candle color sequence is simply a run of consecutive candles that close in the same direction. Three green candles in a row is a bullish streak, five red candles in a row is a bearish streak. The color is decided by the relationship between the open and the close, not by the high or the low, and not by comparison with the previous candle. That makes it one of the cleanest and most objective price-action signals you can track.
Unlike single-candle patterns such as the doji or the shooting star, which focus on the shape of one candle, a color sequence looks at the rhythm of several candles. It answers a different question: is one side of the market in control, and for how long?
How a Streak Is Counted
There is no complex formula. The count works like this:
- Start from the latest closed candle and note its color.
- Move backwards one candle at a time while the color stays the same.
- Stop at the first candle of the opposite color. The number of candles counted is the streak length.
Only closed candles should be counted. A candle that is still forming can flip from green to red in a few seconds, so alerts built on open candles tend to be noisy. A candle that has opened exactly at its close (a perfect doji) is usually treated as neutral and ends the streak.
How to Read a Color Sequence
A streak can be read in two opposite ways, and the right interpretation depends on the context.
Momentum reading
In a healthy trend, consecutive candles of the same color confirm that the move has strength. Three or four green candles breaking above a resistance level show sustained buying pressure, not a single spike. Traders who follow the trend use the streak as confirmation to enter or to hold their position.
Exhaustion reading
The longer a streak gets, the more stretched the move becomes. Six or seven red candles after a sharp drop often mean that sellers are running out of fuel, and a bounce becomes more likely. Mean-reversion traders watch for long streaks to prepare a counter-trend entry, ideally once the first candle of the opposite color closes.
The same streak can mean continuation or exhaustion. What changes the reading is where it happens: at a key level, after a long trend, or in the middle of a range.
Choosing the Streak Length for Crypto
Crypto trades around the clock and is far more volatile than traditional markets, so streak lengths behave differently on each timeframe:
- 1 to 5 minutes: streaks of 3 are very common and mostly noise. Wait for 5 or more to get a meaningful signal.
- 15 minutes to 1 hour: 3 or 4 consecutive candles are a good starting point for momentum signals.
- 4 hours to 1 day: even 3 candles in the same direction are significant, because each candle represents a large amount of trading activity. 5 or more is rare and often marks a major move.
Large caps such as Bitcoin and Ethereum tend to produce longer, cleaner streaks than small altcoins, whose candles flip color more randomly. Always check how often a given streak length appears on the pair you trade, and adjust the number until the signal is rare enough to be worth acting on.
Combining Color Sequences With Other Tools
A candle streak is a trigger, not a complete strategy. It becomes much more reliable when combined with context:
- Support and resistance: a green streak that closes above a resistance level is much stronger than one that stalls just below it.
- RSI: a long red streak with the RSI below 30 supports an exhaustion reading, while a green streak with the RSI still below 60 leaves room for the move to continue.
- Volume: rising volume during the streak confirms conviction, while falling volume warns that the move is losing steam.
- Candlestick patterns: a doji or a shooting star appearing at the end of a long streak is a classic sign that the direction may be about to change.
Limits and Common Mistakes
Color sequences are simple, and simplicity has a cost. A streak says nothing about the size of the candles: three tiny green candles and three large green candles count the same. Streaks also lag, since you only know about them once the candles have closed. In a sideways market, streaks flip constantly and generate many false signals.
The most common mistake is to assume that a long streak guarantees a reversal. Trends can stay stretched for much longer than expected, especially during news-driven moves. Use the streak as a prompt to look at the chart, not as an automatic buy or sell order, and always define your stop-loss before entering.
Setting Up a Candle Color Alert on TradingSignal
Watching candles all day is exhausting, and a streak can complete while you are away from the screen. In the TradingSignal app, creating a candle color alert takes less than a minute:
- Choose the trading pair you want to monitor, for example BTC/USDT on Binance.
- Select the Candle Color alert type.
- Set the parameters: the color you want to detect (green or red) and the number of consecutive candles.
- Define the condition so the alert fires when that sequence is detected on a closed candle.
- Pick the interval, from 1 minute up to 1 week, that matches your trading style.
As soon as the sequence appears, you receive an instant push notification, and you can also receive it by email. You can create as many candle color alerts as you want across different pairs and timeframes, and combine them with price, RSI or volume alerts to build a complete monitoring setup without staring at the charts.
This article is for educational purposes only and is not financial advice. Trading cryptocurrencies involves significant risk.