Breakout Trading Explained: A Complete Guide to Range Breakouts and Fake Breaks
Oct 12, 2026
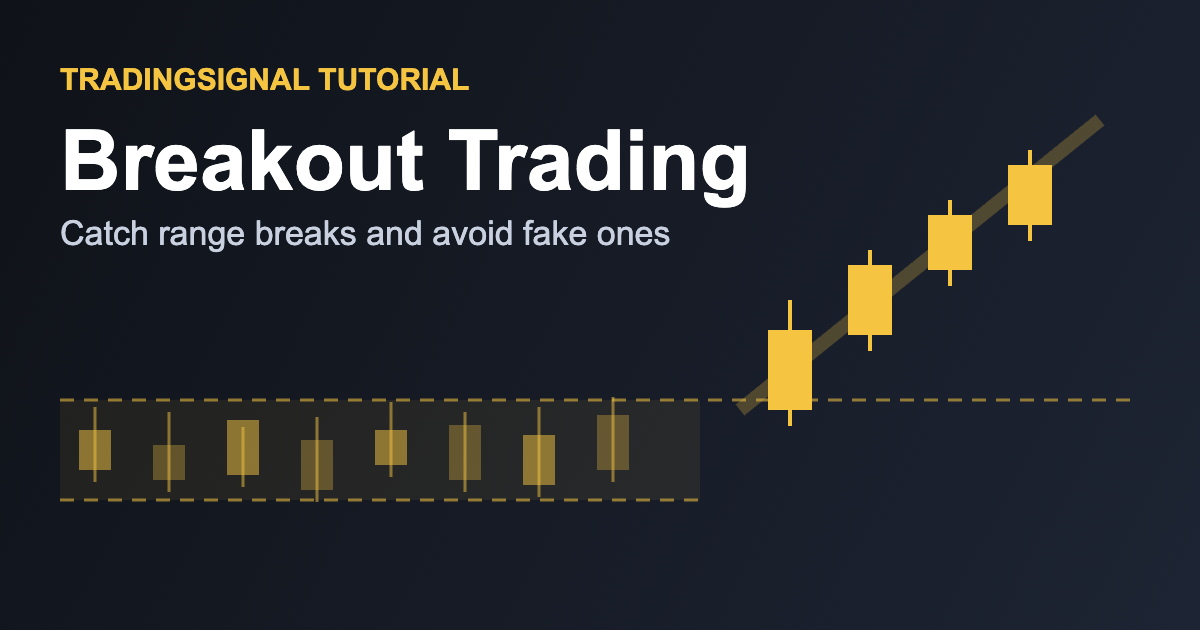
Learn what a breakout is, how range breakouts are calculated, how to tell real breaks from fake ones in crypto, and how to set up automatic Breakout alerts on TradingSignal.
Every strong trend starts with a break. For days or weeks the price bounces inside a range, buyers and sellers cancel each other out, and then one side finally wins. Breakout trading is the art of catching that moment: entering when price escapes a well-defined zone and rides the momentum that follows. In this guide you will learn what a breakout is, how it is identified, how to separate real breakouts from fake ones in crypto, and how to get automatic alerts the second one happens.
What Is a Breakout?
A breakout occurs when price closes above a recent high or below a recent low, leaving the range it has been trading in. The range can be a horizontal channel, a triangle, a flag, or simply the highest high and lowest low of the last N candles. The longer and tighter the range, the more energy is stored, and the more powerful the breakout tends to be.
There are two directions. A bullish breakout moves above resistance and suggests buyers have taken control. A bearish breakout, sometimes called a breakdown, moves below support and suggests sellers have won.
How a Breakout Is Calculated
The most common objective method is the range breakout, often called a Donchian-style channel:
- Lookback period: choose a number of candles, for example 20.
- Range high: the highest high of those candles.
- Range low: the lowest low of those candles.
- Breakout signal: price closes above the range high (bullish) or below the range low (bearish).
For example, if Ethereum traded between 2,400 and 2,550 over the last 20 four-hour candles, a close at 2,570 is a bullish breakout, and a close at 2,380 is a bearish one. Using closes instead of wicks filters out many false moves caused by brief spikes.
How to Read a Breakout
Not all breakouts are equal. Use these checks before trusting one:
- Volume: real breakouts usually come with a clear increase in volume. A break on weak volume is suspicious.
- Candle strength: a large candle with a body that closes near its high (or low, for breakdowns) shows conviction.
- Range quality: a range tested several times before the break is more reliable than a level touched once.
- Retest: price often returns to the broken level to test it from the other side. If the old resistance holds as new support, the breakout is confirmed.
- Market context: breakouts in the direction of the higher timeframe trend succeed more often than counter-trend ones.
Fake Breakouts and How to Avoid Them
Fake breakouts, or false breaks, happen when price pokes outside the range, attracts traders, then snaps back inside. Crypto is full of them because of liquidity hunts and leveraged liquidations. To reduce the damage:
- Wait for a candle close beyond the level, not just a wick.
- Require a volume increase, for example 1.5x to 2x the recent average.
- Consider waiting for the retest before entering.
- Place your stop-loss back inside the range, where the breakout idea is clearly invalidated.
Best Settings for Crypto
- Lookback: 20 candles is a flexible default. Use 50 or more to detect larger, more meaningful ranges, and 10 for short-term scalping.
- Timeframe: 1-hour to daily charts provide fewer but cleaner signals. Very short timeframes produce many false breaks.
- Sessions: because crypto never sleeps, many breakouts happen around the opening of the US and Asian sessions or around major news.
- Pairs: focus on liquid markets such as BTC, ETH, SOL and BNB, where a break is less likely to be caused by a single large order.
Combining Breakouts With Other Tools
- Volume Spike: the best confirmation. A breakout with a spike deserves far more attention than one without.
- Support and Resistance: identify the levels first, then watch for the break.
- ADX: a rising ADX above 20 or 25 suggests that a real trend is developing after the break.
- Bollinger Bands: a squeeze followed by a breakout is a classic volatility expansion setup.
- RSI and MACD: use them to check that momentum supports the direction of the move.
Limitations to Keep in Mind
Breakouts are simple, which is both their strength and weakness. Markets spend a large part of their time in ranges, and many breaks fail. A breakout can also arrive late: by the time the candle closes, part of the move may already be done, so entry price and stop distance must be planned carefully. Slippage is another risk during fast moves. No signal wins every time, so treat breakouts as probabilities, size positions modestly, and always define where you are wrong before you enter.
Setting Up a Breakout Alert on TradingSignal
You do not have to watch charts for hours waiting for a range to break. Setting up a Breakout alert in the TradingSignal app is quick:
- Pair: pick the crypto pair you want to follow, for example BTC/USDT or ETH/USDT.
- Alert type: choose Breakout from the strategy signals.
- Parameters: set the lookback period that defines the recent range, such as 20 candles.
- Condition: the alert fires when price breaks above or below that recent range.
- Interval: select the timeframe, from 1 minute to weekly, that fits your style.
When the break happens, TradingSignal sends an instant push notification so you can check the chart, look at volume, and decide calmly. For extra confirmation, pair your Breakout alert with a Volume Spike alert on the same market.
This article is for educational purposes only and is not financial advice.