Volume Spike Explained: A Complete Guide to Spotting Surges in Trading Volume
Oct 12, 2026
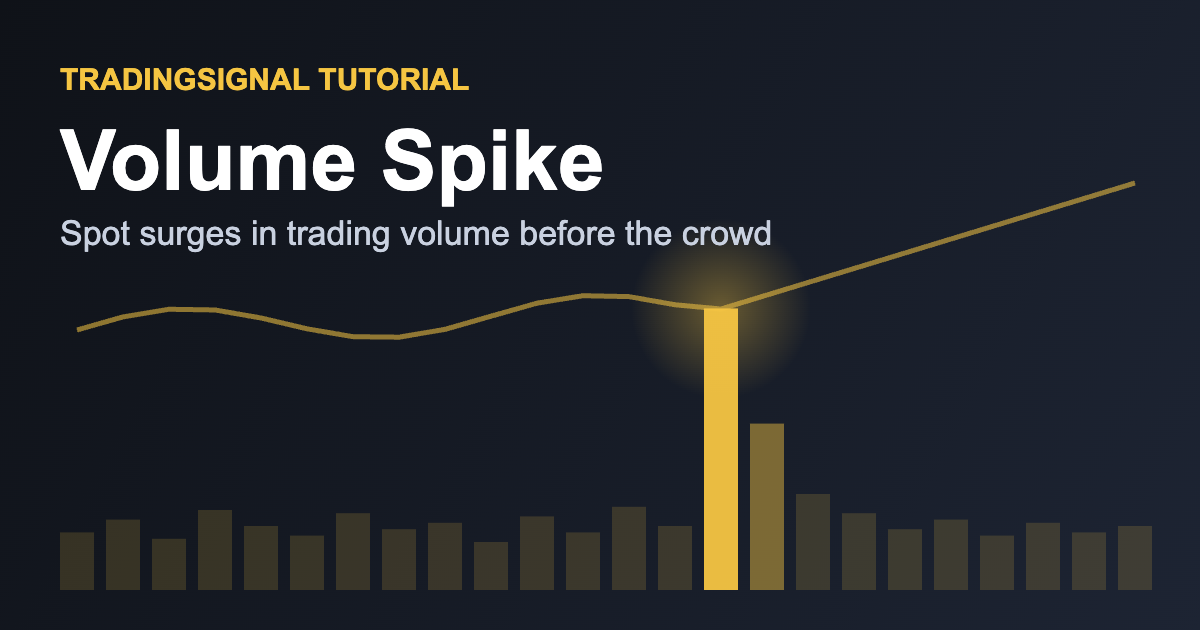
Learn what a volume spike is, how it is calculated, how to read it in crypto markets, which settings work best, and how to set up automatic Volume Spike alerts on TradingSignal.
Price tells you where the market is going, but volume tells you how many traders actually believe in the move. A breakout on thin volume often fades within hours, while the same breakout on a wave of buying or selling can launch a multi-day trend. A volume spike is the simplest way to spot that wave the moment it appears. In this guide you will learn what a volume spike is, how it is measured, how to read it in crypto markets, and how to be alerted automatically instead of watching charts all day.
What Is a Volume Spike?
Volume is the total amount of an asset traded during a given candle. A volume spike happens when the volume of the current candle jumps well above what is normal for that pair and timeframe. Instead of asking "is this number big?", a spike compares the present activity with the recent past, so a quiet altcoin and a heavily traded pair like BTC/USDT can both be judged fairly.
Spikes matter because large volume means large participants. News, liquidations, exchange listings, whale transfers and macro events all leave a footprint in volume before the story is obvious on social media.
How a Volume Spike Is Calculated
The most common method uses a moving average of volume and a multiplier:
- Average volume: the simple average of the last N candles, typically 20.
- Multiplier: a threshold such as 2x or 3x.
- Spike condition: current volume is greater than average volume multiplied by the threshold.
For example, if the 20-candle average on the 1-hour chart is 1,000 BTC and the current candle reaches 2,500 BTC, the volume ratio is 2.5. With a 2x threshold, this counts as a spike. Higher multipliers produce fewer but stronger signals.
How to Read a Volume Spike
A spike alone does not tell you the direction. You always read it together with the candle that carries it:
- Spike with a strong green candle: aggressive buying. If it breaks resistance, the move is more likely to hold.
- Spike with a strong red candle: aggressive selling or liquidations, often seen when support breaks.
- Spike with a small body and long wicks: a fight between buyers and sellers with no clear winner. This can mark exhaustion or a reversal.
- Spike after a long trend: often a climax. Heavy volume at the end of a rally or sell-off can signal that the last participants are entering.
- Spike in a tight range: frequently the first sign of a breakout and the start of a new move.
Always wait for the candle to close. Volume builds during the candle, so a spike that looks huge halfway through may normalize by the close.
Best Settings for Crypto
Crypto trades 24/7, so volume follows daily rhythms such as the opening of Asian, European and US sessions. Keep these points in mind:
- Average length: 20 candles is a solid default. Use 50 for smoother, slower markets and 10 for fast scalping.
- Multiplier: start with 2x on major pairs and 3x on small caps, where random bursts are more common.
- Timeframe: 15-minute to 4-hour charts balance speed and reliability. On 1-minute charts, noise dominates.
- Pair selection: favor liquid pairs. A single large order can fake a spike on an illiquid market.
Combining Volume Spikes With Other Tools
Volume is a confirmation tool, so it works best alongside other signals:
- Support and resistance: a spike at a key level tells you whether the level is likely to break or hold.
- RSI: a spike with RSI above 70 or below 30 may point to an extreme move that is ready to cool down.
- MACD or moving averages: a crossover accompanied by a volume spike carries more weight than one on average volume.
- Candlestick patterns: a Doji or Shooting Star on a spike can strengthen a reversal case.
- Breakouts: the classic combination. A range break with a spike is far more trustworthy than one without.
Limitations to Keep in Mind
Volume spikes are powerful, but they are not magic. Spikes can come from exchange-specific events, wash trading, or one-off liquidations that do not change the larger trend. Volume is also reported differently across exchanges, so a spike on one venue may not appear on another. Finally, a spike tells you that something happened, not what happens next. Treat it as a reason to look closer, then use price action, structure and risk management to decide. Never rely on a single indicator, and always size your positions so that a wrong signal does not hurt.
Setting Up a Volume Spike Alert on TradingSignal
You do not need to stare at volume bars all day. In the TradingSignal app, creating a Volume Spike alert takes less than a minute:
- Pair: choose the crypto pair you want to monitor, such as BTC/USDT or SOL/USDT.
- Alert type: select Volume Spike in the list of strategy signals.
- Parameters: set the average length (for example 20 candles) and the multiplier (for example 2x or 3x).
- Condition: the alert fires when volume exceeds the multiple of its recent average.
- Interval: pick the timeframe, from 1 minute to weekly, that matches your trading style.
Once saved, TradingSignal watches the market for you and sends an instant push notification when a spike appears, so you can open the chart exactly when the market becomes interesting. You can also add Price and Breakout alerts on the same pair to build a complete watchlist.
This article is for educational purposes only and is not financial advice.