ADX Indicator Explained: A Complete Guide to the Average Directional Index
Oct 1, 2026
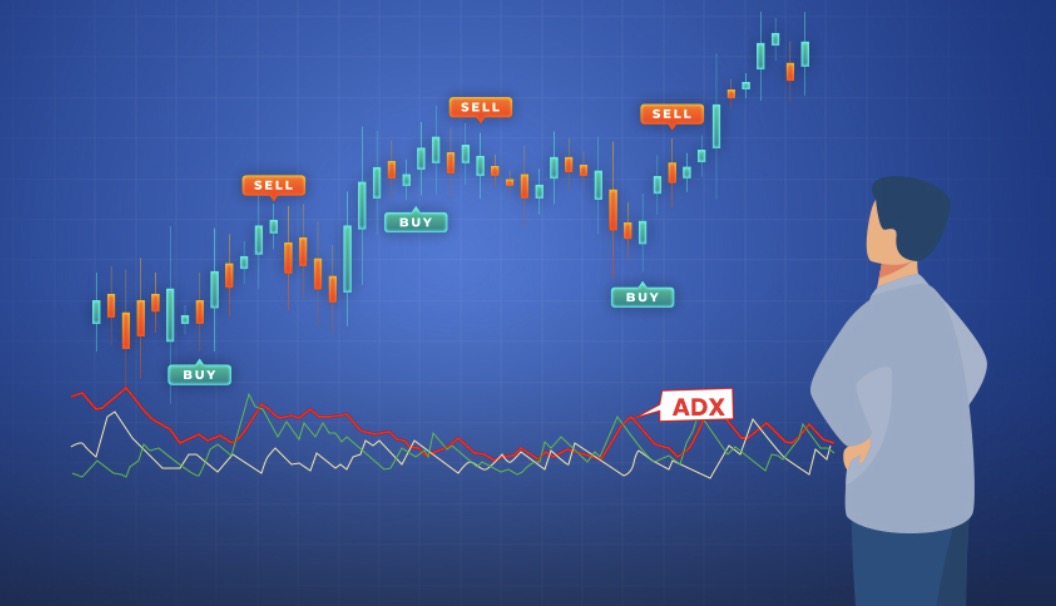
Learn what the ADX (Average Directional Index) is, how it is calculated, how to read trend strength with +DI and -DI, the best ADX settings for crypto, and how to set up an automatic ADX alert on TradingSignal.
The Average Directional Index (ADX) is one of the most useful tools in technical analysis for answering a simple but critical question: is the market trending, and how strong is that trend? Many indicators tell you which way price is moving, but very few measure the strength of the move itself. That is exactly what the ADX does. This guide explains what the ADX indicator is, how it is calculated, how to read its values, the best settings for crypto, and how to set up an automatic ADX alert on TradingSignal.
What Is the ADX Indicator?
The ADX was developed by J. Welles Wilder, the same analyst behind the RSI, and introduced in his 1978 book "New Concepts in Technical Trading Systems." It is part of the Directional Movement System, which is made up of three lines:
- ADX: measures the strength of the trend, regardless of its direction.
- +DI (Positive Directional Indicator): measures the strength of upward price movement.
- -DI (Negative Directional Indicator): measures the strength of downward price movement.
The ADX moves on a scale from 0 to 100. The key point to remember is that the ADX is non-directional: a rising ADX means the trend is getting stronger, whether that trend is bullish or bearish. To know the direction, traders look at the +DI and -DI lines.
How Is the ADX Calculated?
The ADX calculation looks complex at first, but it follows a logical sequence. With the default length of 14 periods:
- Directional Movement: for each candle, compare the current high with the previous high (+DM) and the current low with the previous low (-DM). Only the larger of the two moves is counted; the other is set to zero.
- True Range (TR): the largest of the current high minus current low, the absolute value of current high minus previous close, and the absolute value of current low minus previous close.
- Smoothing: +DM, -DM and TR are smoothed over 14 periods using Wilder's smoothing method.
- Directional Indicators: +DI = 100 × (smoothed +DM / smoothed TR) and -DI = 100 × (smoothed -DM / smoothed TR).
- Directional Index (DX): DX = 100 × |(+DI − -DI)| / (+DI + -DI).
- ADX: the ADX is the smoothed moving average of the DX over 14 periods.
You never need to calculate this by hand: every charting platform and TradingSignal compute it automatically. What matters is understanding that the ADX grows when one side (buyers or sellers) clearly dominates the other.
How to Read the ADX
The most common way to interpret the ADX is by using value ranges:
- 0 to 20: weak or absent trend. The market is ranging or consolidating.
- 20 to 25: a trend may be emerging. This is the zone many traders watch for a breakout.
- 25 to 50: strong trend. Trend-following strategies tend to work best here.
- 50 to 75: very strong trend.
- Above 75: extremely strong trend, which is rare and often close to exhaustion.
The slope of the ADX also matters. A rising ADX means the trend is gaining strength, while a falling ADX means momentum is fading, even if price is still moving in the same direction. A falling ADX from a high level is often an early warning that a trend is running out of steam.
ADX and the +DI / -DI Crossover
Because the ADX only measures strength, it is usually combined with the directional lines to build trading signals:
- Bullish signal: +DI crosses above -DI while the ADX is above 20 or 25. Buyers are in control and the trend has enough strength.
- Bearish signal: -DI crosses above +DI while the ADX is above 20 or 25. Sellers are in control.
- No trade zone: DI crossovers that happen while the ADX is below 20 are often false signals in a choppy market.
This filter is the main strength of the ADX: it helps you avoid trading crossovers and breakouts in markets that have no real direction.
Choosing an ADX Length and Timeframe
The classic setting is 14 periods, as recommended by Wilder. A shorter length (7 to 10) makes the ADX react faster but produces more noise, while a longer length (20 to 30) gives smoother, more reliable readings with more lag.
In crypto, where markets trade 24/7 and volatility is high, many traders use the 14-period ADX on the 1h and 4h charts for swing trading, and on the daily chart to identify the dominant trend. Scalpers on 5m or 15m charts sometimes raise their threshold to 30 to filter out the extra noise of lower timeframes.
Practical ADX Trading Strategies
1. Trend filter
Use the ADX as a gatekeeper. Only take trend-following trades (moving average crossovers, breakouts, Supertrend signals) when the ADX is above 25. When it is below 20, switch to range strategies such as support and resistance or oscillators like the RSI.
2. Breakout confirmation
When price breaks out of a range and the ADX rises from below 20 to above 25, the breakout has a much higher chance of turning into a real trend.
3. Trend exhaustion
When the ADX reaches very high levels (above 50) and starts to turn down, the trend may be losing strength. This can be a signal to tighten stop losses or take partial profits.
Combining the ADX With Other Tools
The ADX is most powerful as part of a complete setup:
- Moving averages or EMA to confirm the direction of the trend the ADX says is strong.
- RSI or Stochastic RSI to time entries during pullbacks inside a strong trend.
- Volume to confirm that a rising ADX is backed by real market participation.
- Support and resistance to place stop losses and targets.
Limitations of the ADX
- The ADX is a lagging indicator: because of its double smoothing, it confirms trends after they have started.
- It does not show direction on its own; you need +DI, -DI or price action for that.
- A falling ADX does not mean the trend has reversed, only that it is weakening.
- In sudden, news-driven crypto moves, the ADX can react too slowly to be useful for entries.
As with any indicator, the ADX should be used together with sound risk management and never as a standalone buy or sell signal.
Setting Up an ADX Alert on TradingSignal
Watching the ADX on dozens of pairs all day is impossible, and that is exactly where TradingSignal helps. In the app, it is very easy to create an alert based on the ADX: simply pick your pair, choose the ADX indicator and set your parameters:
- Level: the ADX value you want to watch (for example 25 to detect the start of a strong trend, or 20 to spot a market falling back into a range).
- Length: the number of periods used for the ADX (14 is the classic setting).
- Condition: whether you want to be notified when the ADX crosses above or below your level.
- Interval: the candle timeframe to calculate the ADX on, from 1-minute to daily charts.
Save your alert and TradingSignal will notify you instantly by push notification or email the moment the ADX crosses the value you have set, on any of the 1,500+ pairs available on Binance, KuCoin and more. You can also combine it with an RSI, MACD or EMA crossover alert to build a complete trend-following setup, without having to stare at charts all day.